29
/
en
AIzaSyAYiBZKx7MnpbEhh9jyipgxe19OcubqV5w
April 1, 2024
140762
Ghana
GHA
true
2
1
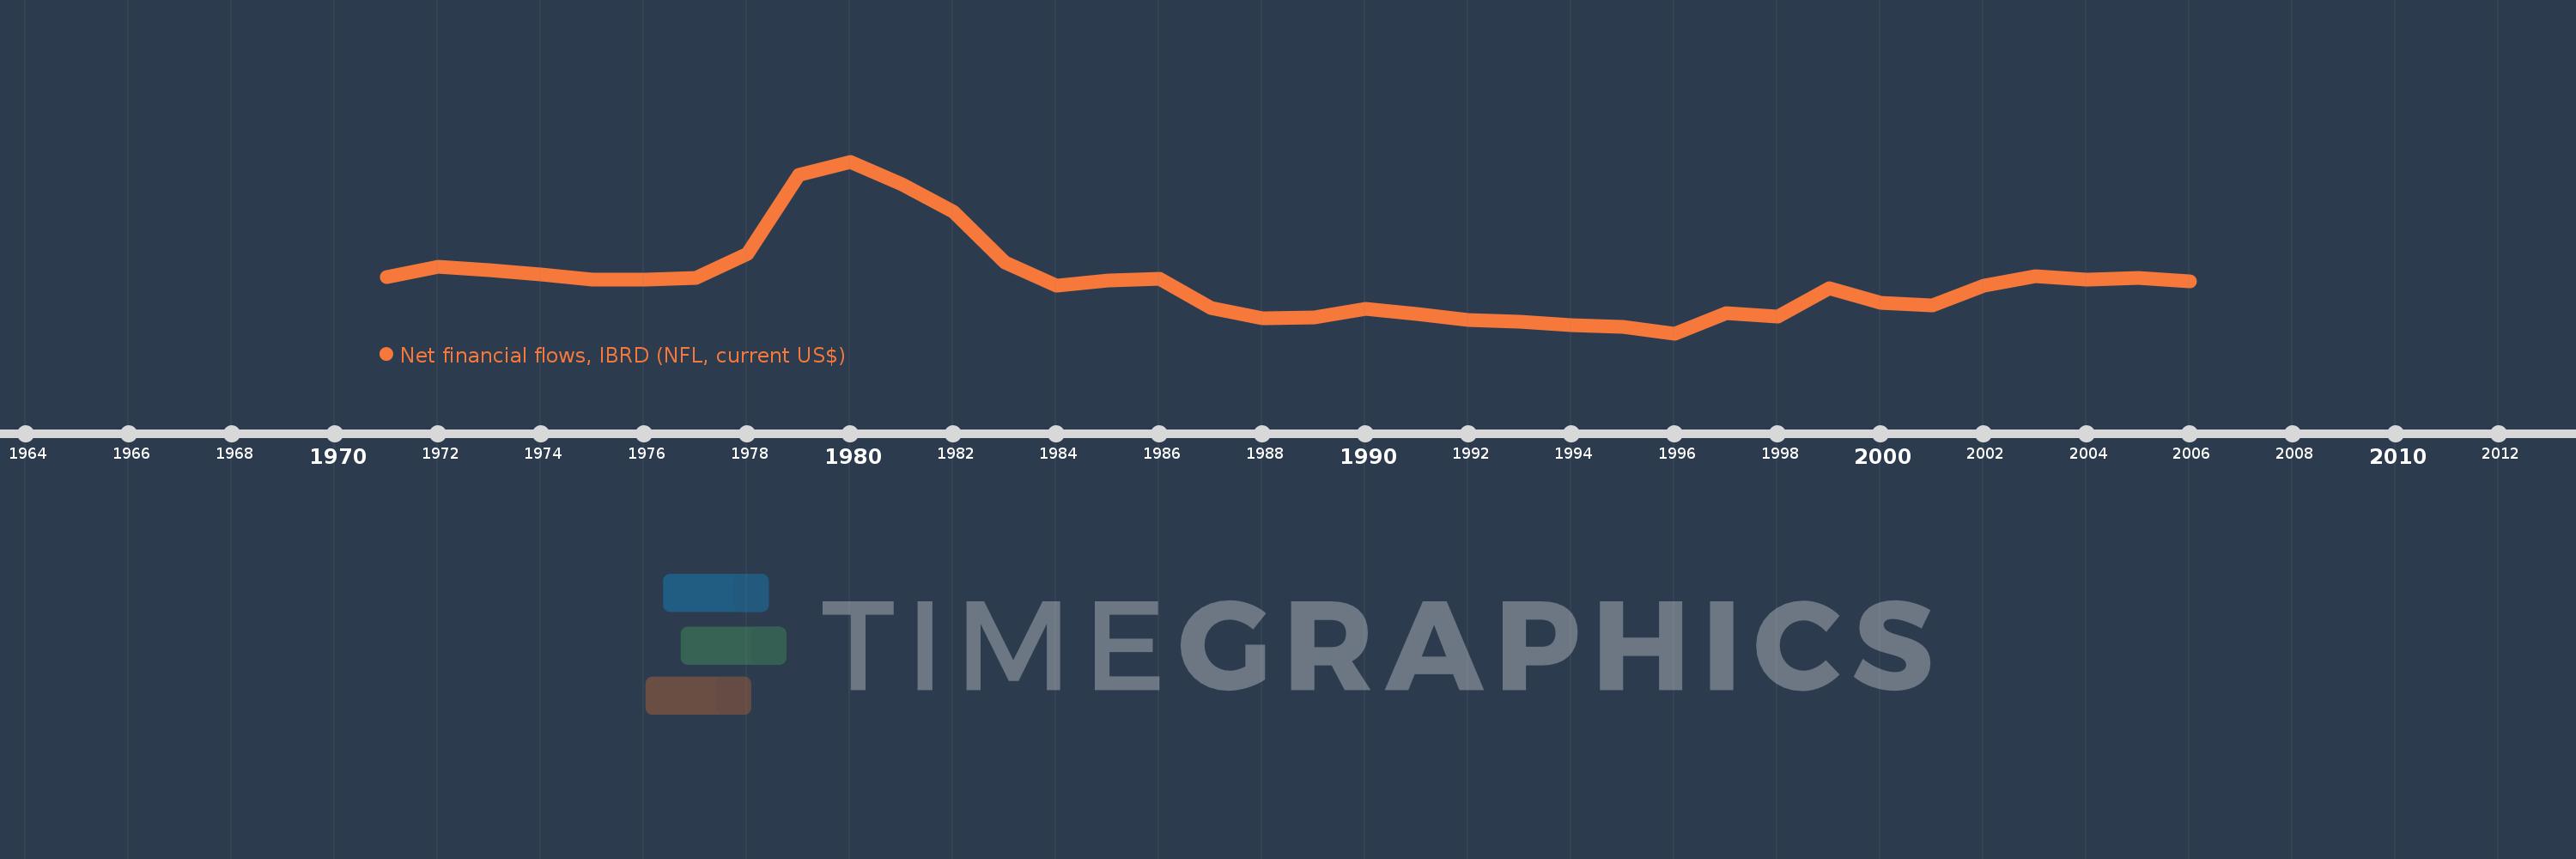
Net financial flows, IBRD (NFL, current US$)
2006,2005,2004,2003,2002,2001,2000,1999,1998,1997,1996,1995,1994,1993,1992,1991,1990,1989,1988,1987,1986,1985,1984,1983,1982,1981,1980,1979,1978,1977,1976,1975,1974,1973,1972,1971
This statistics in other country:
Timeline:
This timeline shows a graph from 1971 to 2006 of Ghana. No data until 1970. Number of actual observations by date: 36.
Source name:
World Development Indicators
Source organization:
World Bank, International Debt Statistics.
Categories, topics:
External Debt
Last updated:
apr 23, 2017
Indicators value changes by year
Minimum:
-15.004 mln
jan 1, 1996
Maximum:
26.821 mln
jan 1, 1980
At the date of observation
Value
Absolute change
Change from previous value
jan 1, 1971
-1.376 mln
-1.376 mln
0.0%
jan 1, 1972
1.173 mln
+2.549 mln
-185.25%
jan 1, 1973
350.0K
-823.0K
-70.16%
jan 1, 1974
-682.0K
-1.032 mln
-294.86%
jan 1, 1975
-1.907 mln
-1.225 mln
179.62%
jan 1, 1976
-2.018 mln
-111.0K
5.82%
jan 1, 1977
-1.446 mln
+572.0K
-28.34%
jan 1, 1978
4.406 mln
+5.852 mln
-404.7%
jan 1, 1979
23.489 mln
+19.083 mln
433.11%
jan 1, 1980
26.821 mln
+3.332 mln
14.19%
jan 1, 1981
21.293 mln
-5.528 mln
-20.61%
jan 1, 1982
14.619 mln
-6.674 mln
-31.34%
jan 1, 1983
2.297 mln
-12.322 mln
-84.29%
jan 1, 1984
-3.368 mln
-5.665 mln
-246.63%
jan 1, 1985
-2.144 mln
+1.224 mln
-36.34%
jan 1, 1986
-1.777 mln
+367.0K
-17.12%
jan 1, 1987
-8.823 mln
-7.046 mln
396.51%
jan 1, 1988
-11.415 mln
-2.592 mln
29.38%
jan 1, 1989
-11.172 mln
+243.0K
-2.13%
jan 1, 1990
-9.078 mln
+2.094 mln
-18.74%
jan 1, 1991
-10.378 mln
-1.3 mln
14.32%
jan 1, 1992
-11.696 mln
-1.318 mln
12.7%
jan 1, 1993
-12.148 mln
-452.0K
3.86%
jan 1, 1994
-13.043 mln
-895.0K
7.37%
jan 1, 1995
-13.429 mln
-386.0K
2.96%
jan 1, 1996
-15.004 mln
-1.575 mln
11.73%
jan 1, 1997
-10.014 mln
+4.99 mln
-33.26%
jan 1, 1998
-10.906 mln
-892.0K
8.91%
jan 1, 1999
-4.12 mln
+6.786 mln
-62.22%
jan 1, 2000
-7.682 mln
-3.562 mln
86.46%
jan 1, 2001
-8.11 mln
-428.0K
5.57%
jan 1, 2002
-3.332 mln
+4.778 mln
-58.91%
jan 1, 2003
-1.178 mln
+2.154 mln
-64.65%
jan 1, 2004
-1.926 mln
-748.0K
63.5%
jan 1, 2005
-1.607 mln
+319.0K
-16.56%
jan 1, 2006
-2.249 mln
-642.0K
39.95%
Ranking of countries by current statistics by years


Comments: