29
/
en
AIzaSyAYiBZKx7MnpbEhh9jyipgxe19OcubqV5w
April 1, 2024
268361
Tunisia
TUN
true
2
1
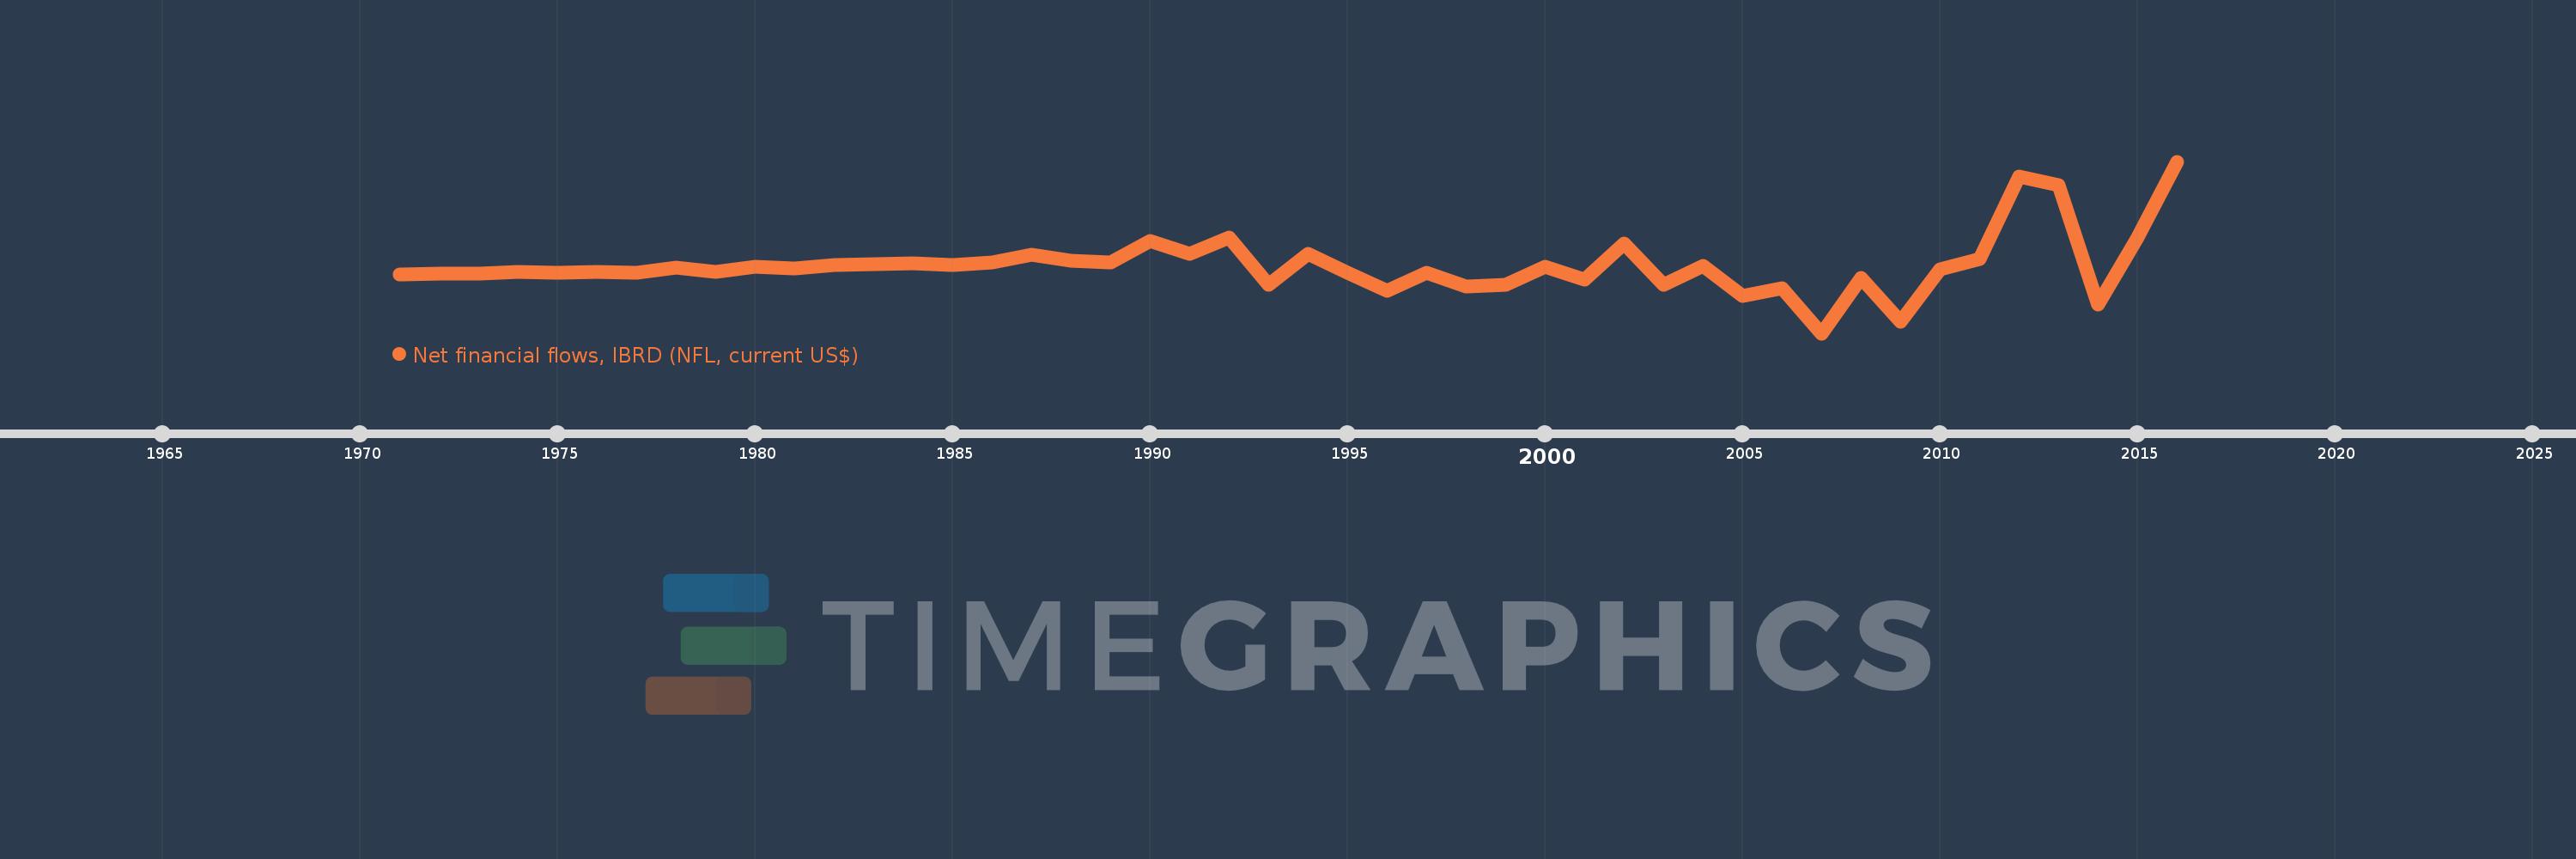
Net financial flows, IBRD (NFL, current US$)
2016,2015,2014,2013,2012,2011,2010,2009,2008,2007,2006,2005,2004,2003,2002,2001,2000,1999,1998,1997,1996,1995,1994,1993,1992,1991,1990,1989,1988,1987,1986,1985,1984,1983,1982,1981,1980,1979,1978,1977,1976,1975,1974,1973,1972,1971
This statistics in other country:
Timeline:
This timeline shows a graph from 1971 to 2016 of Tunisia. No data until 1970. Number of actual observations by date: 46.
Source name:
World Development Indicators
Source organization:
World Bank, International Debt Statistics.
Categories, topics:
External Debt
Last updated:
apr 23, 2017
Indicators value changes by year
Minimum:
-254.627 mln
jan 1, 2007
Maximum:
512.388 mln
jan 1, 2016
At the date of observation
Value
Absolute change
Change from previous value
jan 1, 1971
8.034 mln
+8.034 mln
0.0%
jan 1, 1972
13.494 mln
+5.46 mln
67.96%
jan 1, 1973
12.822 mln
-672.0K
-4.98%
jan 1, 1974
17.9 mln
+5.078 mln
39.6%
jan 1, 1975
17.159 mln
-741.0K
-4.14%
jan 1, 1976
19.648 mln
+2.489 mln
14.51%
jan 1, 1977
16.614 mln
-3.034 mln
-15.44%
jan 1, 1978
37.987 mln
+21.373 mln
128.64%
jan 1, 1979
21.005 mln
-16.982 mln
-44.7%
jan 1, 1980
41.556 mln
+20.551 mln
97.84%
jan 1, 1981
36.233 mln
-5.323 mln
-12.81%
jan 1, 1982
49.854 mln
+13.621 mln
37.59%
jan 1, 1983
55.397 mln
+5.543 mln
11.12%
jan 1, 1984
57.991 mln
+2.594 mln
4.68%
jan 1, 1985
50.89 mln
-7.101 mln
-12.25%
jan 1, 1986
61.93 mln
+11.04 mln
21.69%
jan 1, 1987
94.372 mln
+32.442 mln
52.38%
jan 1, 1988
67.608 mln
-26.764 mln
-28.36%
jan 1, 1989
62.26 mln
-5.348 mln
-7.91%
jan 1, 1990
156.295 mln
+94.035 mln
151.04%
jan 1, 1991
101.787 mln
-54.508 mln
-34.88%
jan 1, 1992
172.365 mln
+70.578 mln
69.34%
jan 1, 1993
-36.911 mln
-209.276 mln
-121.41%
jan 1, 1994
101.237 mln
+138.148 mln
-374.27%
jan 1, 1995
15.247 mln
-85.99 mln
-84.94%
jan 1, 1996
-64.646 mln
-79.893 mln
-523.99%
jan 1, 1997
14.59 mln
+79.236 mln
-122.57%
jan 1, 1998
-45.799 mln
-60.389 mln
-413.91%
jan 1, 1999
-36.507 mln
+9.292 mln
-20.29%
jan 1, 2000
43.781 mln
+80.288 mln
-219.92%
jan 1, 2001
-14.513 mln
-58.294 mln
-133.15%
jan 1, 2002
146.851 mln
+161.364 mln
-1.11K%
jan 1, 2003
-36.879 mln
-183.73 mln
-125.11%
jan 1, 2004
45.751 mln
+82.63 mln
-224.06%
jan 1, 2005
-88.681 mln
-134.432 mln
-293.83%
jan 1, 2006
-54.501 mln
+34.18 mln
-38.54%
jan 1, 2007
-254.627 mln
-200.126 mln
367.2%
jan 1, 2008
-7.999 mln
+246.628 mln
-96.86%
jan 1, 2009
-203.108 mln
-195.109 mln
2.44K%
jan 1, 2010
31.692 mln
+234.8 mln
-115.6%
jan 1, 2011
76.372 mln
+44.68 mln
140.98%
jan 1, 2012
445.722 mln
+369.35 mln
483.62%
jan 1, 2013
405.678 mln
-40.044 mln
-8.98%
jan 1, 2014
-125.008 mln
-530.686 mln
-130.81%
jan 1, 2015
171.55 mln
+296.558 mln
-237.23%
jan 1, 2016
512.388 mln
+340.838 mln
198.68%
Ranking of countries by current statistics by years


Comments: