29
/
en
AIzaSyAYiBZKx7MnpbEhh9jyipgxe19OcubqV5w
April 1, 2024
251094
St. Lucia
LCA
true
2
1
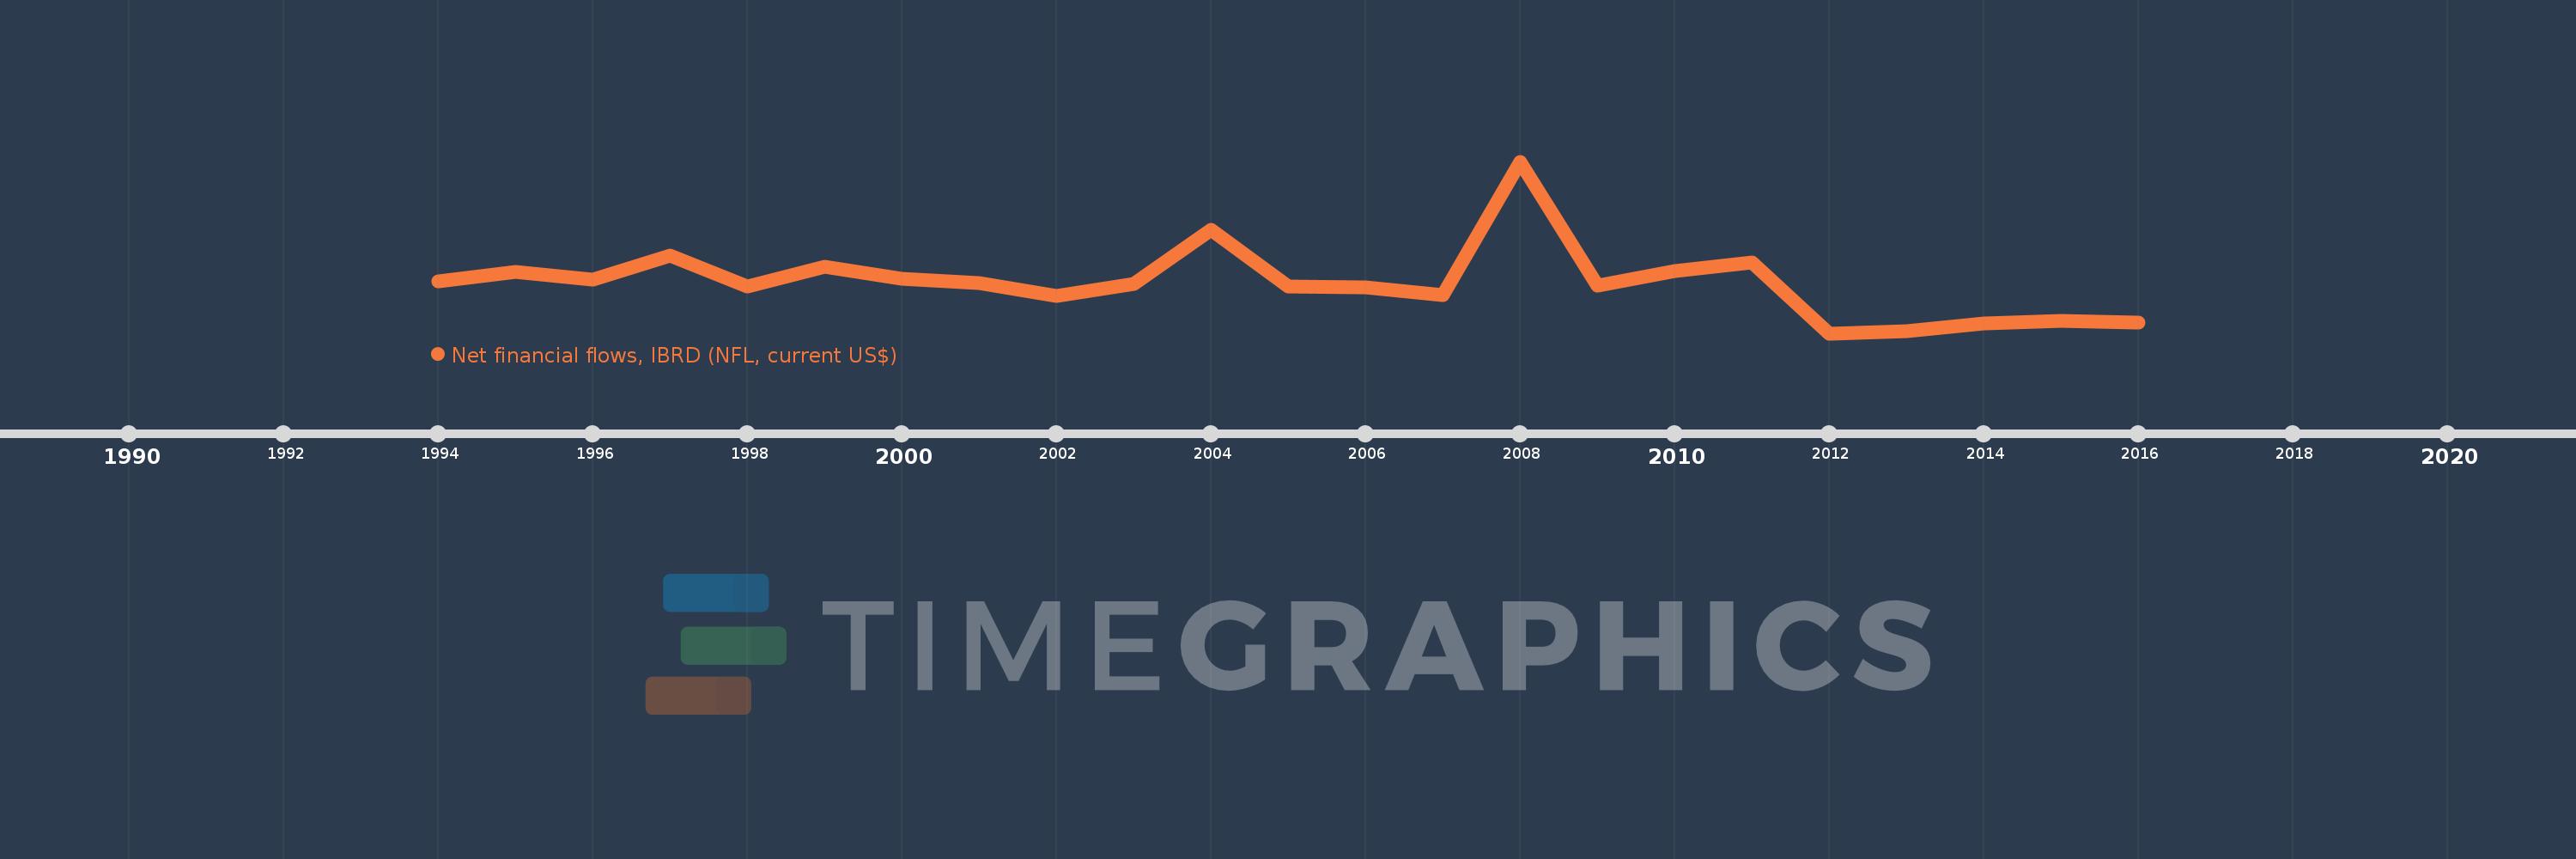
Net financial flows, IBRD (NFL, current US$)
2016,2015,2014,2013,2012,2011,2010,2009,2008,2007,2006,2005,2004,2003,2002,2001,2000,1999,1998,1997,1996,1995,1994
This statistics in other country:
Timeline:
This timeline shows a graph from 1994 to 2016 of St. Lucia. No data until 1993. Number of actual observations by date: 23.
Source name:
World Development Indicators
Source organization:
World Bank, International Debt Statistics.
Categories, topics:
External Debt
Last updated:
apr 23, 2017
Indicators value changes by year
Minimum:
-2.683 mln
jan 1, 2012
Maximum:
7.756 mln
jan 1, 2008
At the date of observation
Value
Absolute change
Change from previous value
jan 1, 1994
460.0K
+460.0K
0.0%
jan 1, 1995
1.03 mln
+570.0K
123.91%
jan 1, 1996
555.0K
-475.0K
-46.12%
jan 1, 1997
2.018 mln
+1.463 mln
263.6%
jan 1, 1998
164.0K
-1.854 mln
-91.87%
jan 1, 1999
1.342 mln
+1.178 mln
718.29%
jan 1, 2000
636.0K
-706.0K
-52.61%
jan 1, 2001
362.0K
-274.0K
-43.08%
jan 1, 2002
-405.0K
-767.0K
-211.88%
jan 1, 2003
321.0K
+726.0K
-179.26%
jan 1, 2004
3.623 mln
+3.302 mln
1.03K%
jan 1, 2005
160.0K
-3.463 mln
-95.58%
jan 1, 2006
126.0K
-34.0K
-21.25%
jan 1, 2007
-377.0K
-503.0K
-399.21%
jan 1, 2008
7.756 mln
+8.133 mln
-2.16K%
jan 1, 2009
230.0K
-7.526 mln
-97.03%
jan 1, 2010
1.079 mln
+849.0K
369.13%
jan 1, 2011
1.611 mln
+532.0K
49.3%
jan 1, 2012
-2.683 mln
-4.294 mln
-266.54%
jan 1, 2013
-2.556 mln
+127.0K
-4.73%
jan 1, 2014
-2.082 mln
+474.0K
-18.54%
jan 1, 2015
-1.946 mln
+136.0K
-6.53%
jan 1, 2016
-2.027 mln
-81.0K
4.16%
Ranking of countries by current statistics by years


Comments: