29
/
en
AIzaSyAYiBZKx7MnpbEhh9jyipgxe19OcubqV5w
April 1, 2024
135869
Gabon
GAB
true
2
1
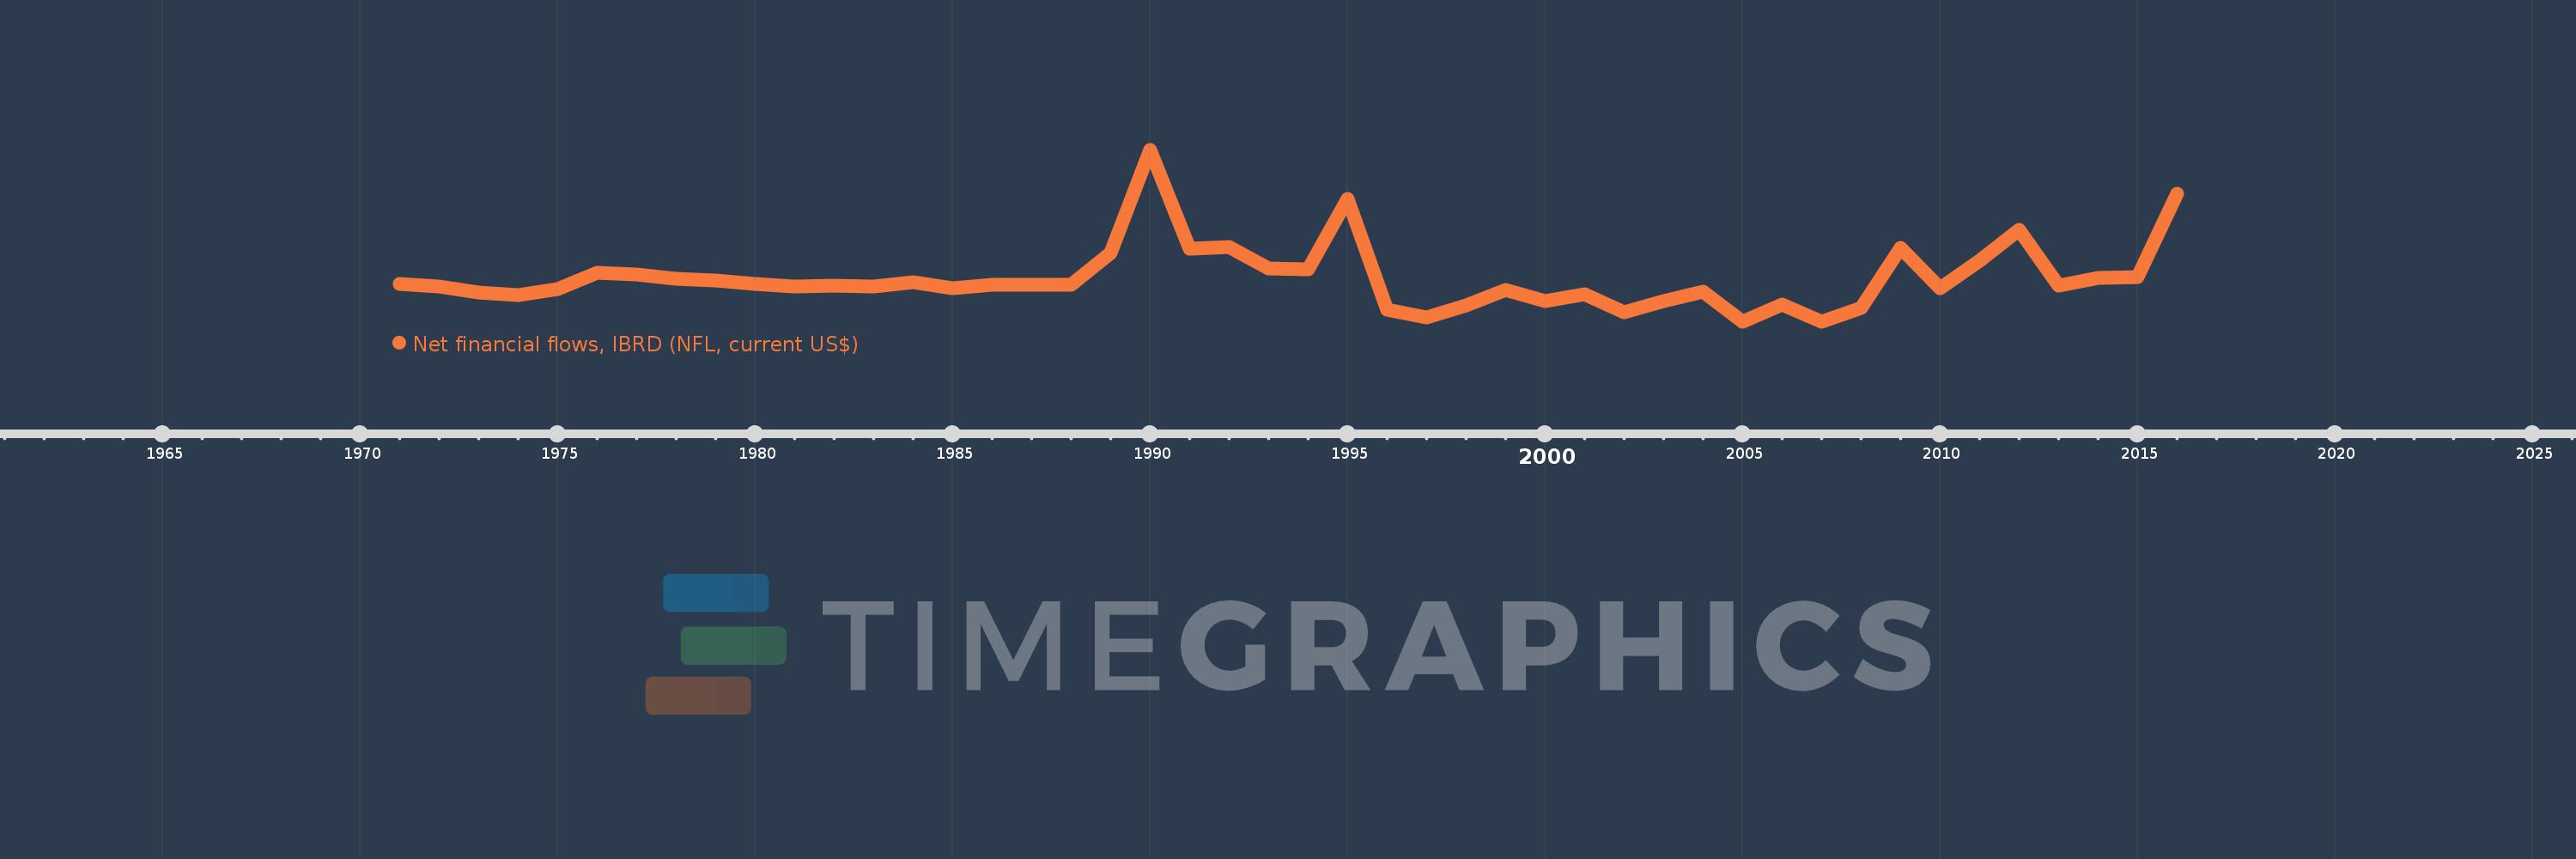
Net financial flows, IBRD (NFL, current US$)
2016,2015,2014,2013,2012,2011,2010,2009,2008,2007,2006,2005,2004,2003,2002,2001,2000,1999,1998,1997,1996,1995,1994,1993,1992,1991,1990,1989,1988,1987,1986,1985,1984,1983,1982,1981,1980,1979,1978,1977,1976,1975,1974,1973,1972,1971
This statistics in other country:
Timeline:
This timeline shows a graph from 1971 to 2016 of Gabon. No data until 1970. Number of actual observations by date: 46.
Source name:
World Development Indicators
Source organization:
World Bank, International Debt Statistics.
Categories, topics:
External Debt
Last updated:
apr 23, 2017
Indicators value changes by year
Minimum:
-11.78 mln
jan 1, 2007
Maximum:
36.614 mln
jan 1, 1990
At the date of observation
Value
Absolute change
Change from previous value
jan 1, 1971
-965.0K
-965.0K
0.0%
jan 1, 1972
-1.684 mln
-719.0K
74.51%
jan 1, 1973
-3.543 mln
-1.859 mln
110.39%
jan 1, 1974
-4.199 mln
-656.0K
18.52%
jan 1, 1975
-2.555 mln
+1.644 mln
-39.15%
jan 1, 1976
1.999 mln
+4.554 mln
-178.24%
jan 1, 1977
1.675 mln
-324.0K
-16.21%
jan 1, 1978
319.0K
-1.356 mln
-80.96%
jan 1, 1979
-22.0K
-341.0K
-106.9%
jan 1, 1980
-948.0K
-926.0K
4.21K%
jan 1, 1981
-1.695 mln
-747.0K
78.8%
jan 1, 1982
-1.663 mln
+32.0K
-1.89%
jan 1, 1983
-1.731 mln
-68.0K
4.09%
jan 1, 1984
-595.0K
+1.136 mln
-65.63%
jan 1, 1985
-2.305 mln
-1.71 mln
287.39%
jan 1, 1986
-1.359 mln
+946.0K
-41.04%
jan 1, 1987
-1.219 mln
+140.0K
-10.3%
jan 1, 1988
-1.257 mln
-38.0K
3.12%
jan 1, 1989
7.605 mln
+8.862 mln
-705.01%
jan 1, 1990
36.614 mln
+29.009 mln
381.45%
jan 1, 1991
8.763 mln
-27.851 mln
-76.07%
jan 1, 1992
9.391 mln
+628.0K
7.17%
jan 1, 1993
3.398 mln
-5.993 mln
-63.82%
jan 1, 1994
3.047 mln
-351.0K
-10.33%
jan 1, 1995
22.829 mln
+19.782 mln
649.23%
jan 1, 1996
-8.42 mln
-31.249 mln
-136.88%
jan 1, 1997
-10.574 mln
-2.154 mln
25.58%
jan 1, 1998
-7.106 mln
+3.468 mln
-32.8%
jan 1, 1999
-2.685 mln
+4.421 mln
-62.22%
jan 1, 2000
-5.946 mln
-3.261 mln
121.45%
jan 1, 2001
-3.894 mln
+2.052 mln
-34.51%
jan 1, 2002
-9.061 mln
-5.167 mln
132.69%
jan 1, 2003
-5.912 mln
+3.149 mln
-34.75%
jan 1, 2004
-3.227 mln
+2.685 mln
-45.42%
jan 1, 2005
-11.684 mln
-8.457 mln
262.07%
jan 1, 2006
-6.979 mln
+4.705 mln
-40.27%
jan 1, 2007
-11.78 mln
-4.801 mln
68.79%
jan 1, 2008
-7.764 mln
+4.016 mln
-34.09%
jan 1, 2009
9.176 mln
+16.94 mln
-218.19%
jan 1, 2010
-2.286 mln
-11.462 mln
-124.91%
jan 1, 2011
5.578 mln
+7.864 mln
-344.01%
jan 1, 2012
14.149 mln
+8.571 mln
153.66%
jan 1, 2013
-1.513 mln
-15.662 mln
-110.69%
jan 1, 2014
753.0K
+2.266 mln
-149.77%
jan 1, 2015
924.0K
+171.0K
22.71%
jan 1, 2016
24.262 mln
+23.338 mln
2.53K%
Ranking of countries by current statistics by years


Comments: