29
/
en
AIzaSyAYiBZKx7MnpbEhh9jyipgxe19OcubqV5w
April 1, 2024
239643
Sierra Leone
SLE
true
2
1
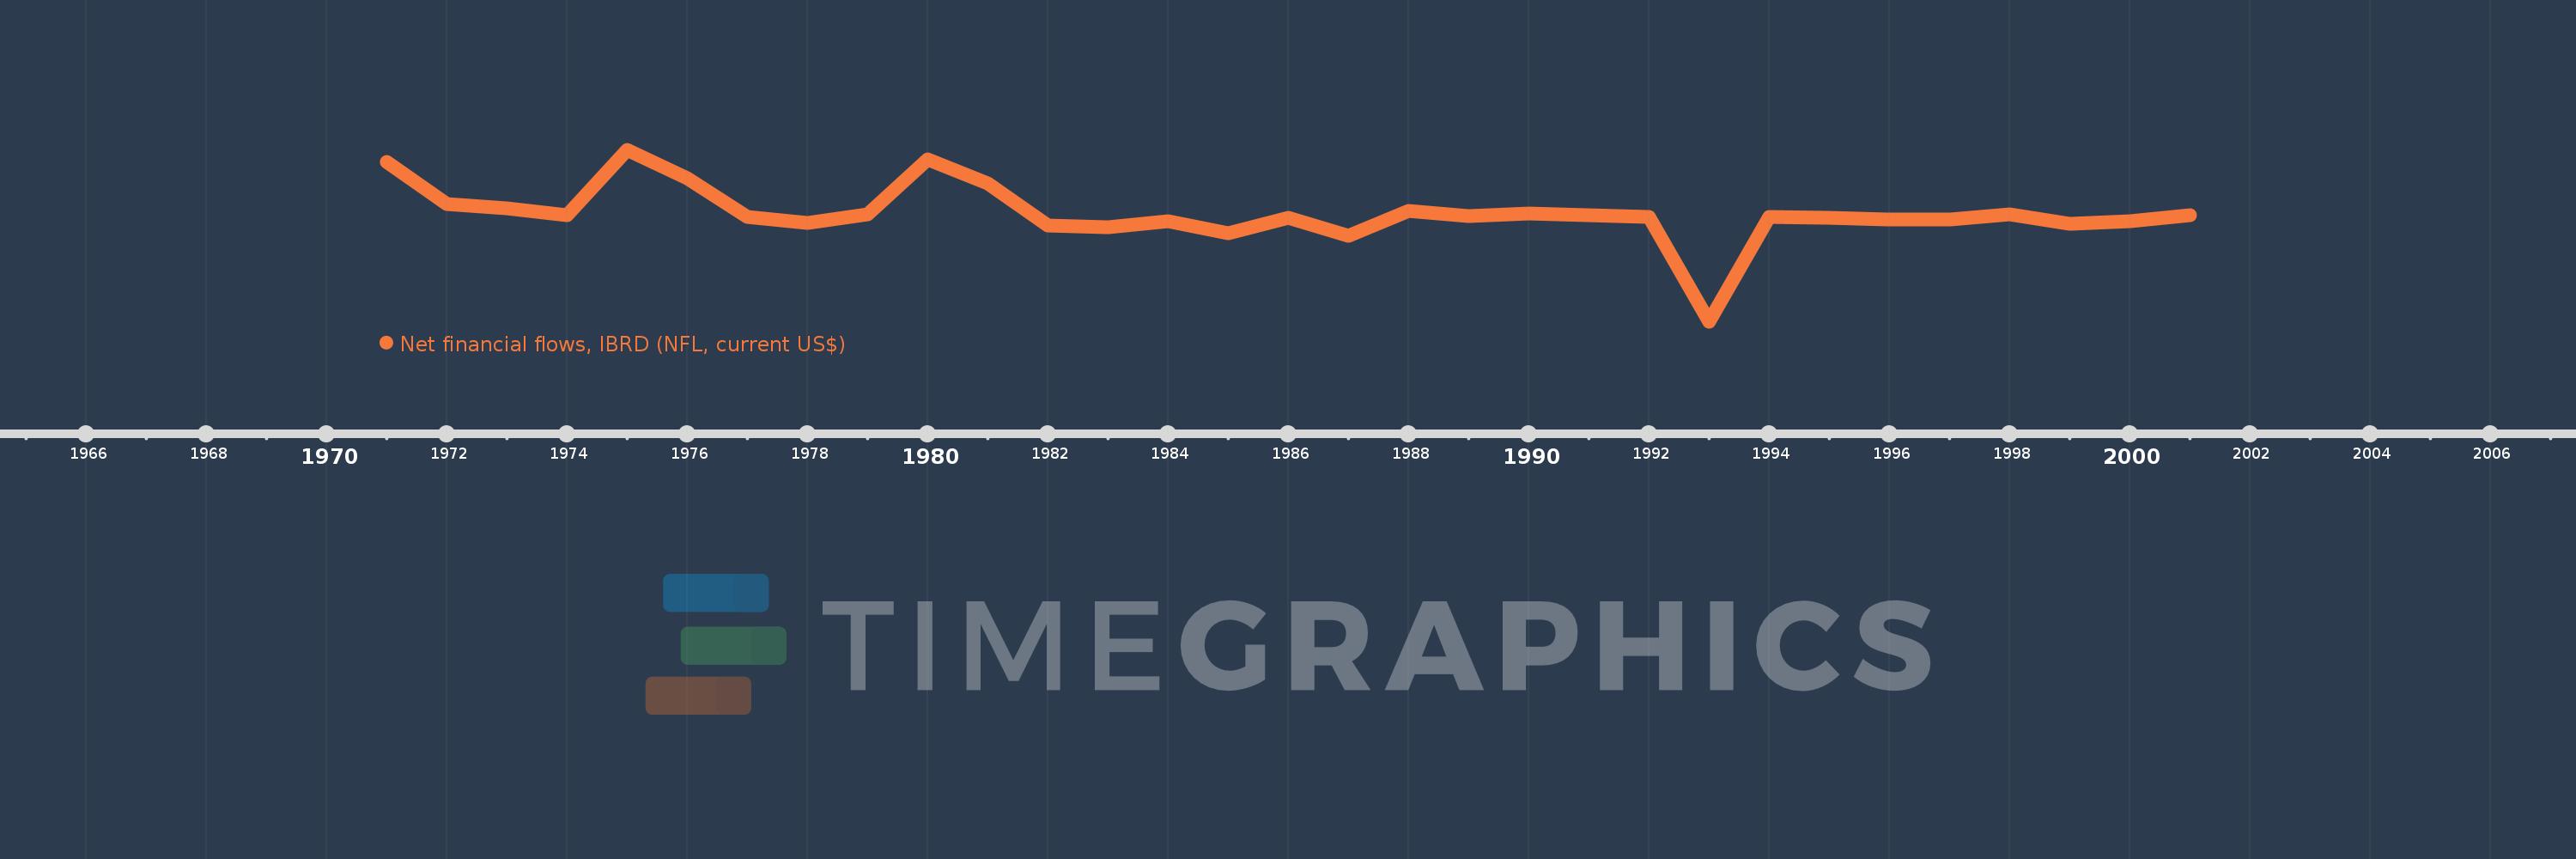
Net financial flows, IBRD (NFL, current US$)
2001,2000,1999,1998,1997,1996,1995,1994,1993,1992,1990,1989,1988,1987,1986,1985,1984,1983,1982,1981,1980,1979,1978,1977,1976,1975,1974,1973,1972,1971
This statistics in other country:
Timeline:
This timeline shows a graph from 1971 to 2001 of Sierra Leone. No data until 1970. Number of actual observations by date: 30.
Source name:
World Development Indicators
Source organization:
World Bank, International Debt Statistics.
Categories, topics:
External Debt
Last updated:
apr 23, 2017
Indicators value changes by year
Minimum:
-6.246 mln
jan 1, 1993
Maximum:
3.344 mln
jan 1, 1975
At the date of observation
Value
Absolute change
Change from previous value
jan 1, 1971
2.673 mln
+2.673 mln
0.0%
jan 1, 1972
354.0K
-2.319 mln
-86.76%
jan 1, 1973
91.0K
-263.0K
-74.29%
jan 1, 1974
-284.0K
-375.0K
-412.09%
jan 1, 1975
3.344 mln
+3.628 mln
-1.28K%
jan 1, 1976
1.791 mln
-1.553 mln
-46.44%
jan 1, 1977
-396.0K
-2.187 mln
-122.11%
jan 1, 1978
-705.0K
-309.0K
78.03%
jan 1, 1979
-249.0K
+456.0K
-64.68%
jan 1, 1980
2.852 mln
+3.101 mln
-1.25K%
jan 1, 1981
1.501 mln
-1.351 mln
-47.37%
jan 1, 1982
-878.0K
-2.379 mln
-158.49%
jan 1, 1983
-958.0K
-80.0K
9.11%
jan 1, 1984
-631.0K
+327.0K
-34.13%
jan 1, 1985
-1.295 mln
-664.0K
105.23%
jan 1, 1986
-409.0K
+886.0K
-68.42%
jan 1, 1987
-1.451 mln
-1.042 mln
254.77%
jan 1, 1988
-36.0K
+1.415 mln
-97.52%
jan 1, 1989
-349.0K
-313.0K
869.44%
jan 1, 1990
-196.0K
+153.0K
-43.84%
jan 1, 1992
-359.0K
-163.0K
83.16%
jan 1, 1993
-6.246 mln
-5.887 mln
1.64K%
jan 1, 1994
-367.0K
+5.879 mln
-94.12%
jan 1, 1995
-431.0K
-64.0K
17.44%
jan 1, 1996
-507.0K
-76.0K
17.63%
jan 1, 1997
-537.0K
-30.0K
5.92%
jan 1, 1998
-241.0K
+296.0K
-55.12%
jan 1, 1999
-763.0K
-522.0K
216.6%
jan 1, 2000
-599.0K
+164.0K
-21.49%
jan 1, 2001
-284.0K
+315.0K
-52.59%
Ranking of countries by current statistics by years


Comments: