29
/
en
AIzaSyAYiBZKx7MnpbEhh9jyipgxe19OcubqV5w
April 1, 2024
61024
Sub-Saharan Africa (IDA & IBRD countries)
TSS
false
2
1
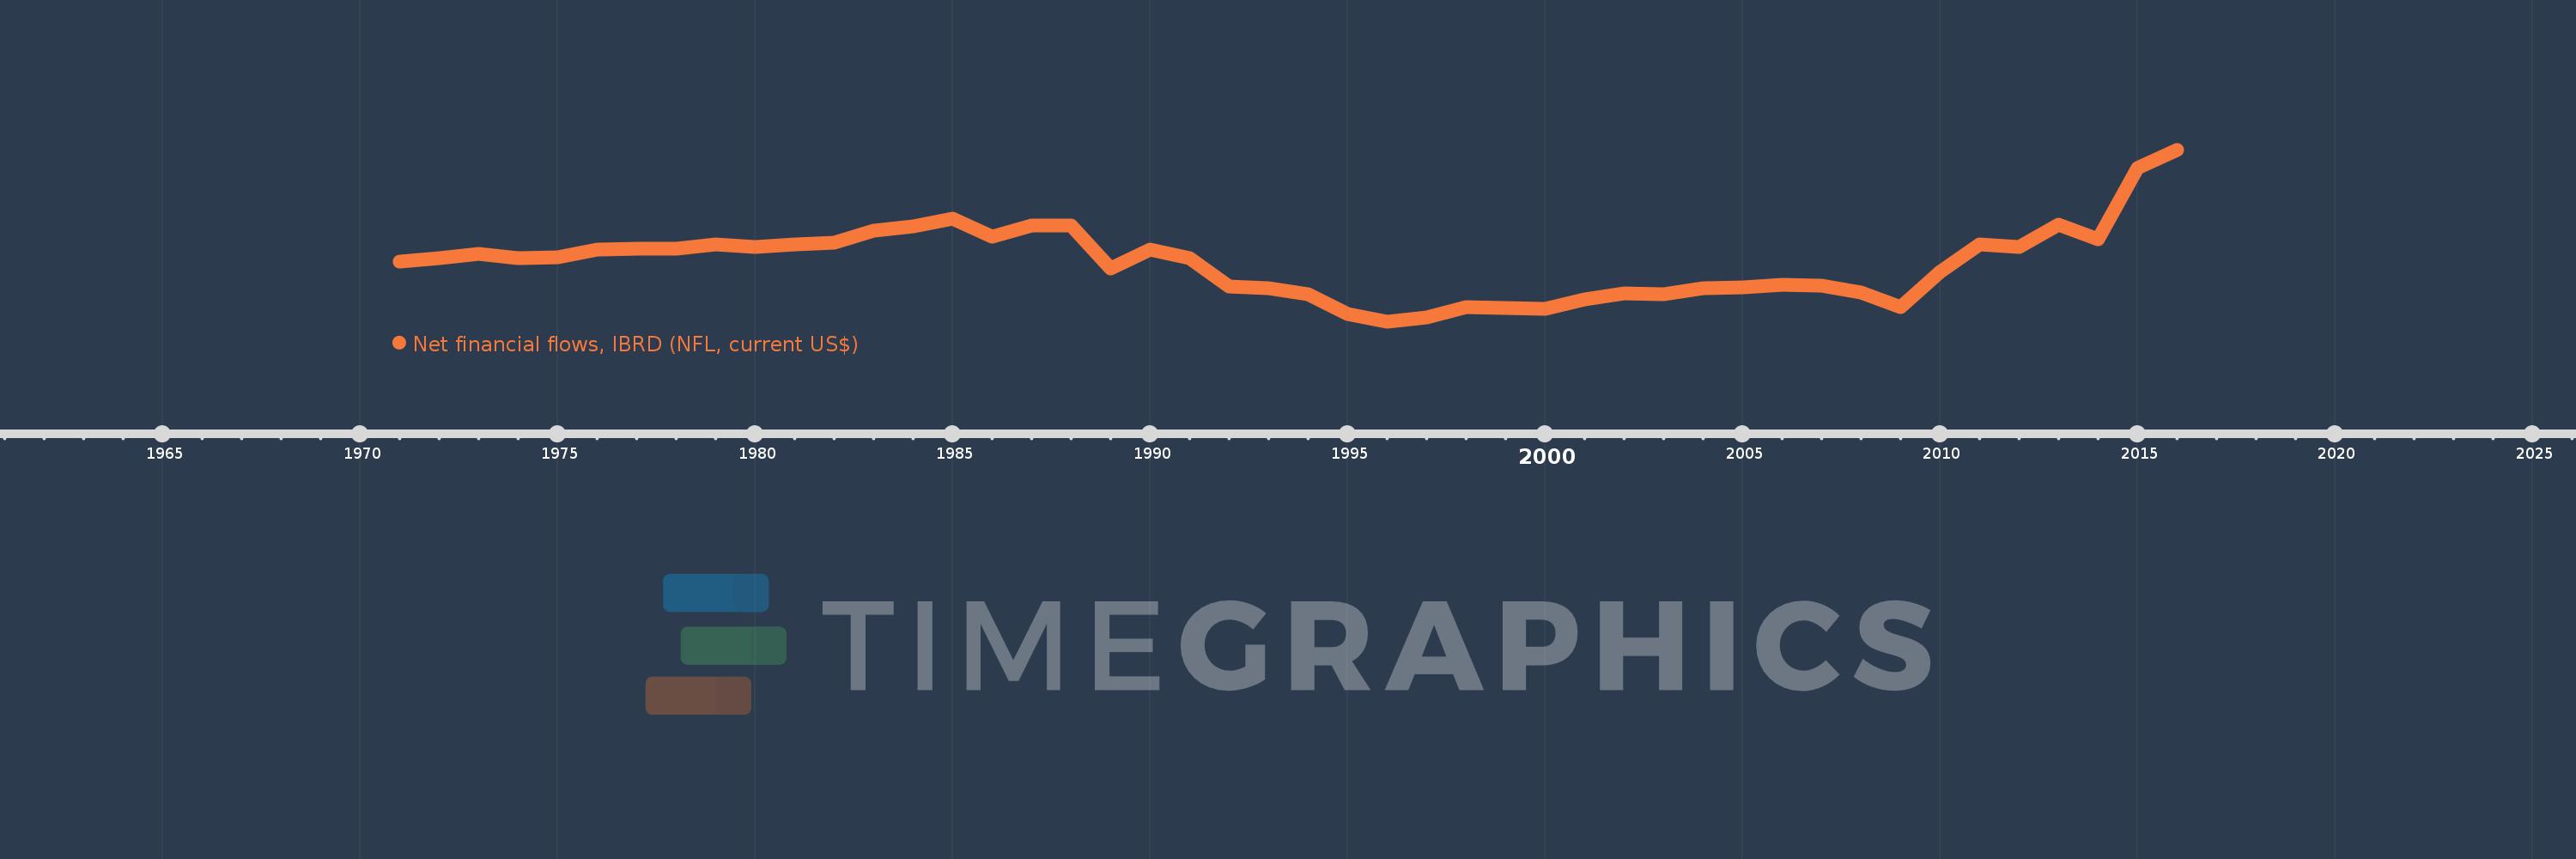
Net financial flows, IBRD (NFL, current US$)
2016,2015,2014,2013,2012,2011,2010,2009,2008,2007,2006,2005,2004,2003,2002,2001,2000,1999,1998,1997,1996,1995,1994,1993,1992,1991,1990,1989,1988,1987,1986,1985,1984,1983,1982,1981,1980,1979,1978,1977,1976,1975,1974,1973,1972,1971
This statistics in other country:
Timeline:
This timeline shows a graph from 1971 to 2016 of Sub-Saharan Africa (IDA & IBRD countries). No data until 1970. Number of actual observations by date: 46.
Source name:
World Development Indicators
Source organization:
World Bank, International Debt Statistics.
Categories, topics:
External Debt
Last updated:
apr 23, 2017
Indicators value changes by year
Minimum:
-782.064 mln
jan 1, 1996
Maximum:
1.585 bln
jan 1, 2016
At the date of observation
Value
Absolute change
Change from previous value
jan 1, 1971
45.466 mln
+45.466 mln
0.0%
jan 1, 1972
91.526 mln
+46.06 mln
101.31%
jan 1, 1973
150.728 mln
+59.202 mln
64.68%
jan 1, 1974
92.428 mln
-58.3 mln
-38.68%
jan 1, 1975
108.278 mln
+15.85 mln
17.15%
jan 1, 1976
219.963 mln
+111.685 mln
103.15%
jan 1, 1977
232.196 mln
+12.233 mln
5.56%
jan 1, 1978
232.459 mln
+263.0K
0.11%
jan 1, 1979
291.262 mln
+58.803 mln
25.3%
jan 1, 1980
247.012 mln
-44.25 mln
-15.19%
jan 1, 1981
288.51 mln
+41.498 mln
16.8%
jan 1, 1982
312.154 mln
+23.644 mln
8.2%
jan 1, 1983
472.9 mln
+160.746 mln
51.5%
jan 1, 1984
536.307 mln
+63.407 mln
13.41%
jan 1, 1985
635.769 mln
+99.462 mln
18.55%
jan 1, 1986
395.503 mln
-240.266 mln
-37.79%
jan 1, 1987
552.389 mln
+156.886 mln
39.67%
jan 1, 1988
546.856 mln
-5.533 mln
-1.0%
jan 1, 1989
-40.551 mln
-587.407 mln
-107.42%
jan 1, 1990
216.305 mln
+256.856 mln
-633.41%
jan 1, 1991
92.123 mln
-124.182 mln
-57.41%
jan 1, 1992
-291.552 mln
-383.675 mln
-416.48%
jan 1, 1993
-322.343 mln
-30.791 mln
10.56%
jan 1, 1994
-397.311 mln
-74.968 mln
23.26%
jan 1, 1995
-670.548 mln
-273.237 mln
68.77%
jan 1, 1996
-782.064 mln
-111.516 mln
16.63%
jan 1, 1997
-720.725 mln
+61.339 mln
-7.84%
jan 1, 1998
-571.652 mln
+149.073 mln
-20.68%
jan 1, 1999
-583.476 mln
-11.824 mln
2.07%
jan 1, 2000
-597.744 mln
-14.268 mln
2.45%
jan 1, 2001
-476.184 mln
+121.56 mln
-20.34%
jan 1, 2002
-382.083 mln
+94.101 mln
-19.76%
jan 1, 2003
-405.115 mln
-23.032 mln
6.03%
jan 1, 2004
-320.381 mln
+84.734 mln
-20.92%
jan 1, 2005
-305.369 mln
+15.012 mln
-4.69%
jan 1, 2006
-272.595 mln
+32.774 mln
-10.73%
jan 1, 2007
-282.891 mln
-10.296 mln
3.78%
jan 1, 2008
-375.693 mln
-92.802 mln
32.8%
jan 1, 2009
-574.901 mln
-199.208 mln
53.02%
jan 1, 2010
-88.943 mln
+485.958 mln
-84.53%
jan 1, 2011
282.68 mln
+371.623 mln
-417.82%
jan 1, 2012
254.767 mln
-27.913 mln
-9.87%
jan 1, 2013
555.618 mln
+300.851 mln
118.09%
jan 1, 2014
362.467 mln
-193.151 mln
-34.76%
jan 1, 2015
1.334 bln
+971.882 mln
268.13%
jan 1, 2016
1.585 bln
+250.39 mln
18.76%
Ranking of countries by current statistics by years


Comments: