29
/
en
AIzaSyAYiBZKx7MnpbEhh9jyipgxe19OcubqV5w
April 1, 2024
121237
Dominica
DMA
true
2
1
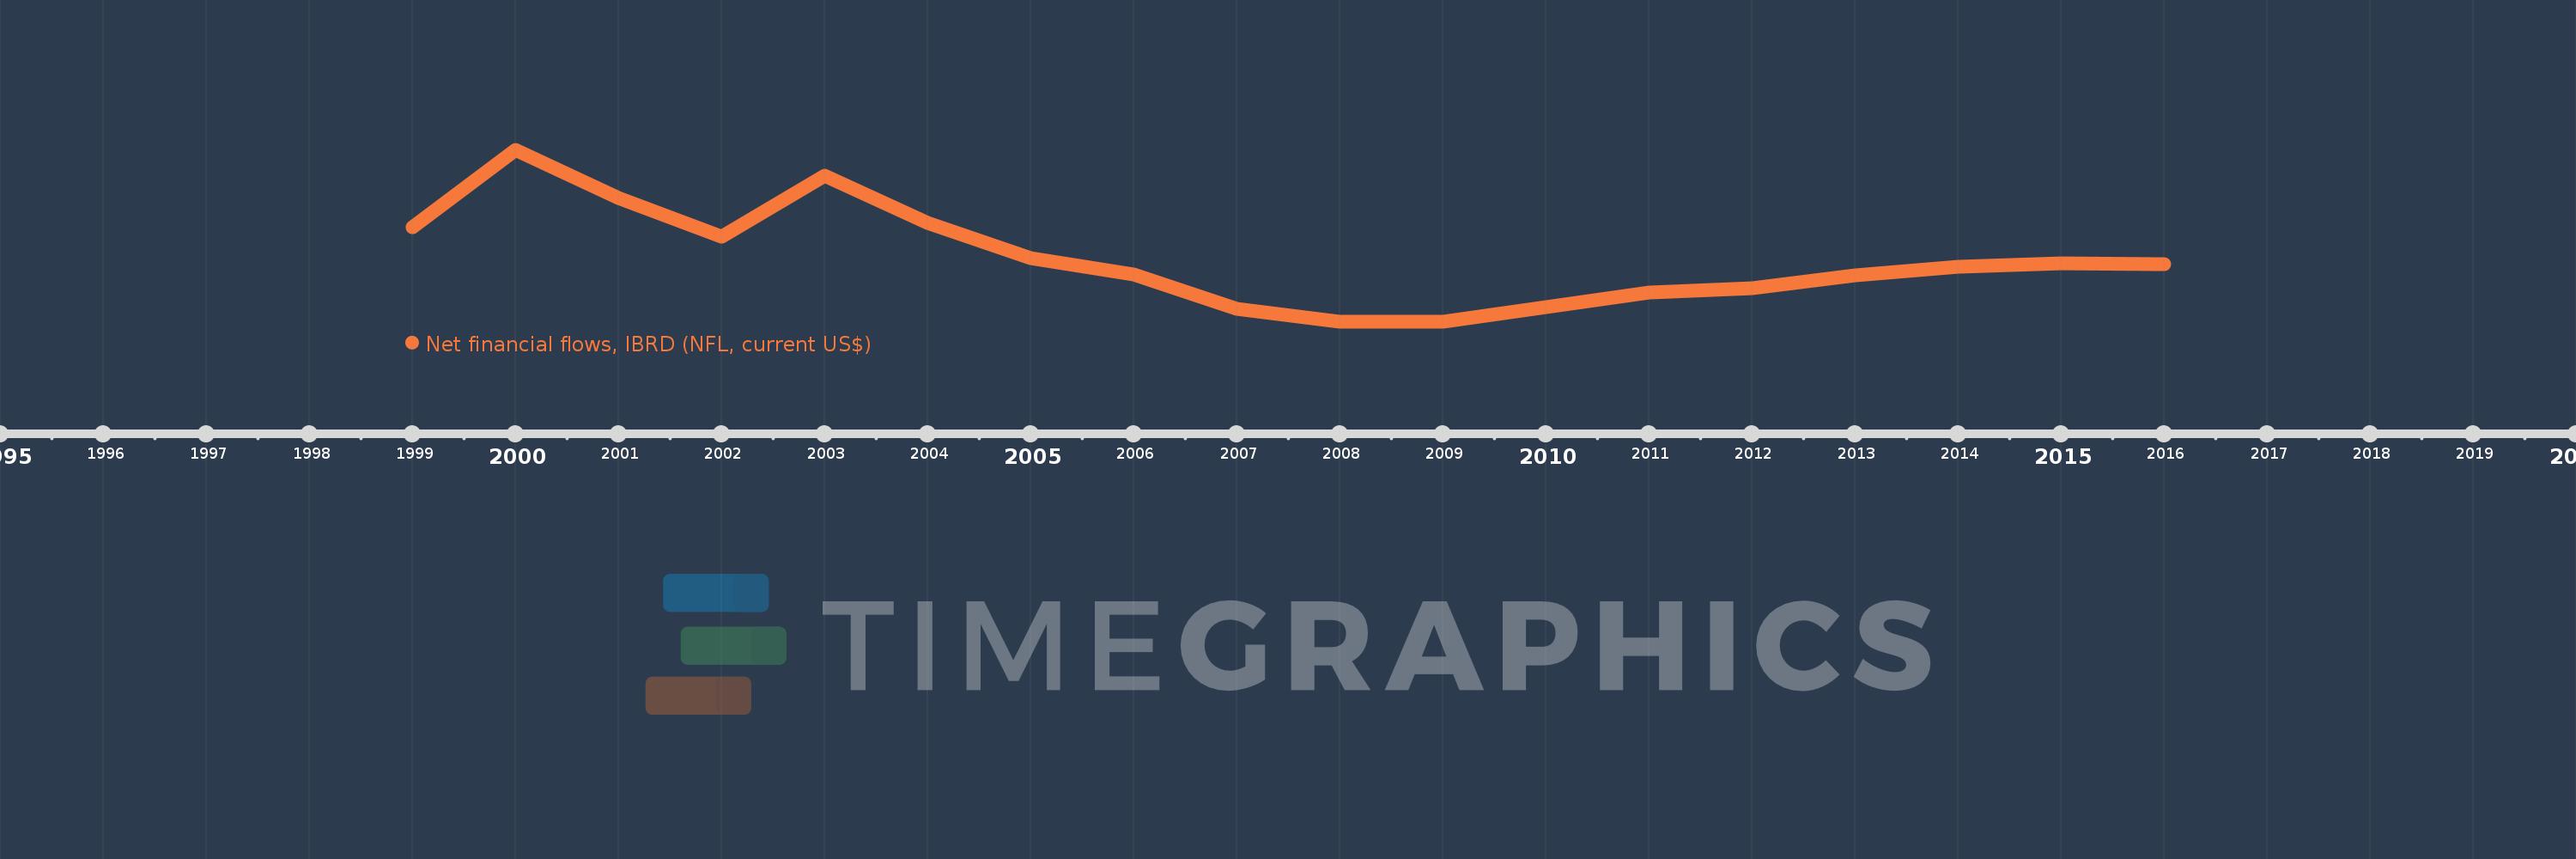
Net financial flows, IBRD (NFL, current US$)
2016,2015,2014,2013,2012,2011,2010,2009,2008,2007,2006,2005,2004,2003,2002,2001,2000,1999
This statistics in other country:
Timeline:
This timeline shows a graph from 1999 to 2016 of Dominica. No data until 1998. Number of actual observations by date: 18.
Source name:
World Development Indicators
Source organization:
World Bank, International Debt Statistics.
Categories, topics:
External Debt
Last updated:
apr 23, 2017
Indicators value changes by year
Minimum:
-757.0K
jan 1, 2008
Maximum:
1.297 mln
jan 1, 2000
At the date of observation
Value
Absolute change
Change from previous value
jan 1, 1999
376.0K
+376.0K
0.0%
jan 1, 2000
1.297 mln
+921.0K
244.95%
jan 1, 2001
730.0K
-567.0K
-43.72%
jan 1, 2002
265.0K
-465.0K
-63.7%
jan 1, 2003
989.0K
+724.0K
273.21%
jan 1, 2004
430.0K
-559.0K
-56.52%
jan 1, 2005
4.0K
-426.0K
-99.07%
jan 1, 2006
-187.0K
-191.0K
-4.78K%
jan 1, 2007
-603.0K
-416.0K
222.46%
jan 1, 2008
-757.0K
-154.0K
25.54%
jan 1, 2009
-755.0K
+2.0K
-0.26%
jan 1, 2010
-577.0K
+178.0K
-23.58%
jan 1, 2011
-408.0K
+169.0K
-29.29%
jan 1, 2012
-358.0K
+50.0K
-12.25%
jan 1, 2013
-200.0K
+158.0K
-44.13%
jan 1, 2014
-97.0K
+103.0K
-51.5%
jan 1, 2015
-59.0K
+38.0K
-39.18%
jan 1, 2016
-61.0K
-2.0K
3.39%
Ranking of countries by current statistics by years


Comments: