29
/
en
AIzaSyAYiBZKx7MnpbEhh9jyipgxe19OcubqV5w
April 1, 2024
80907
Belarus
BLR
true
2
1
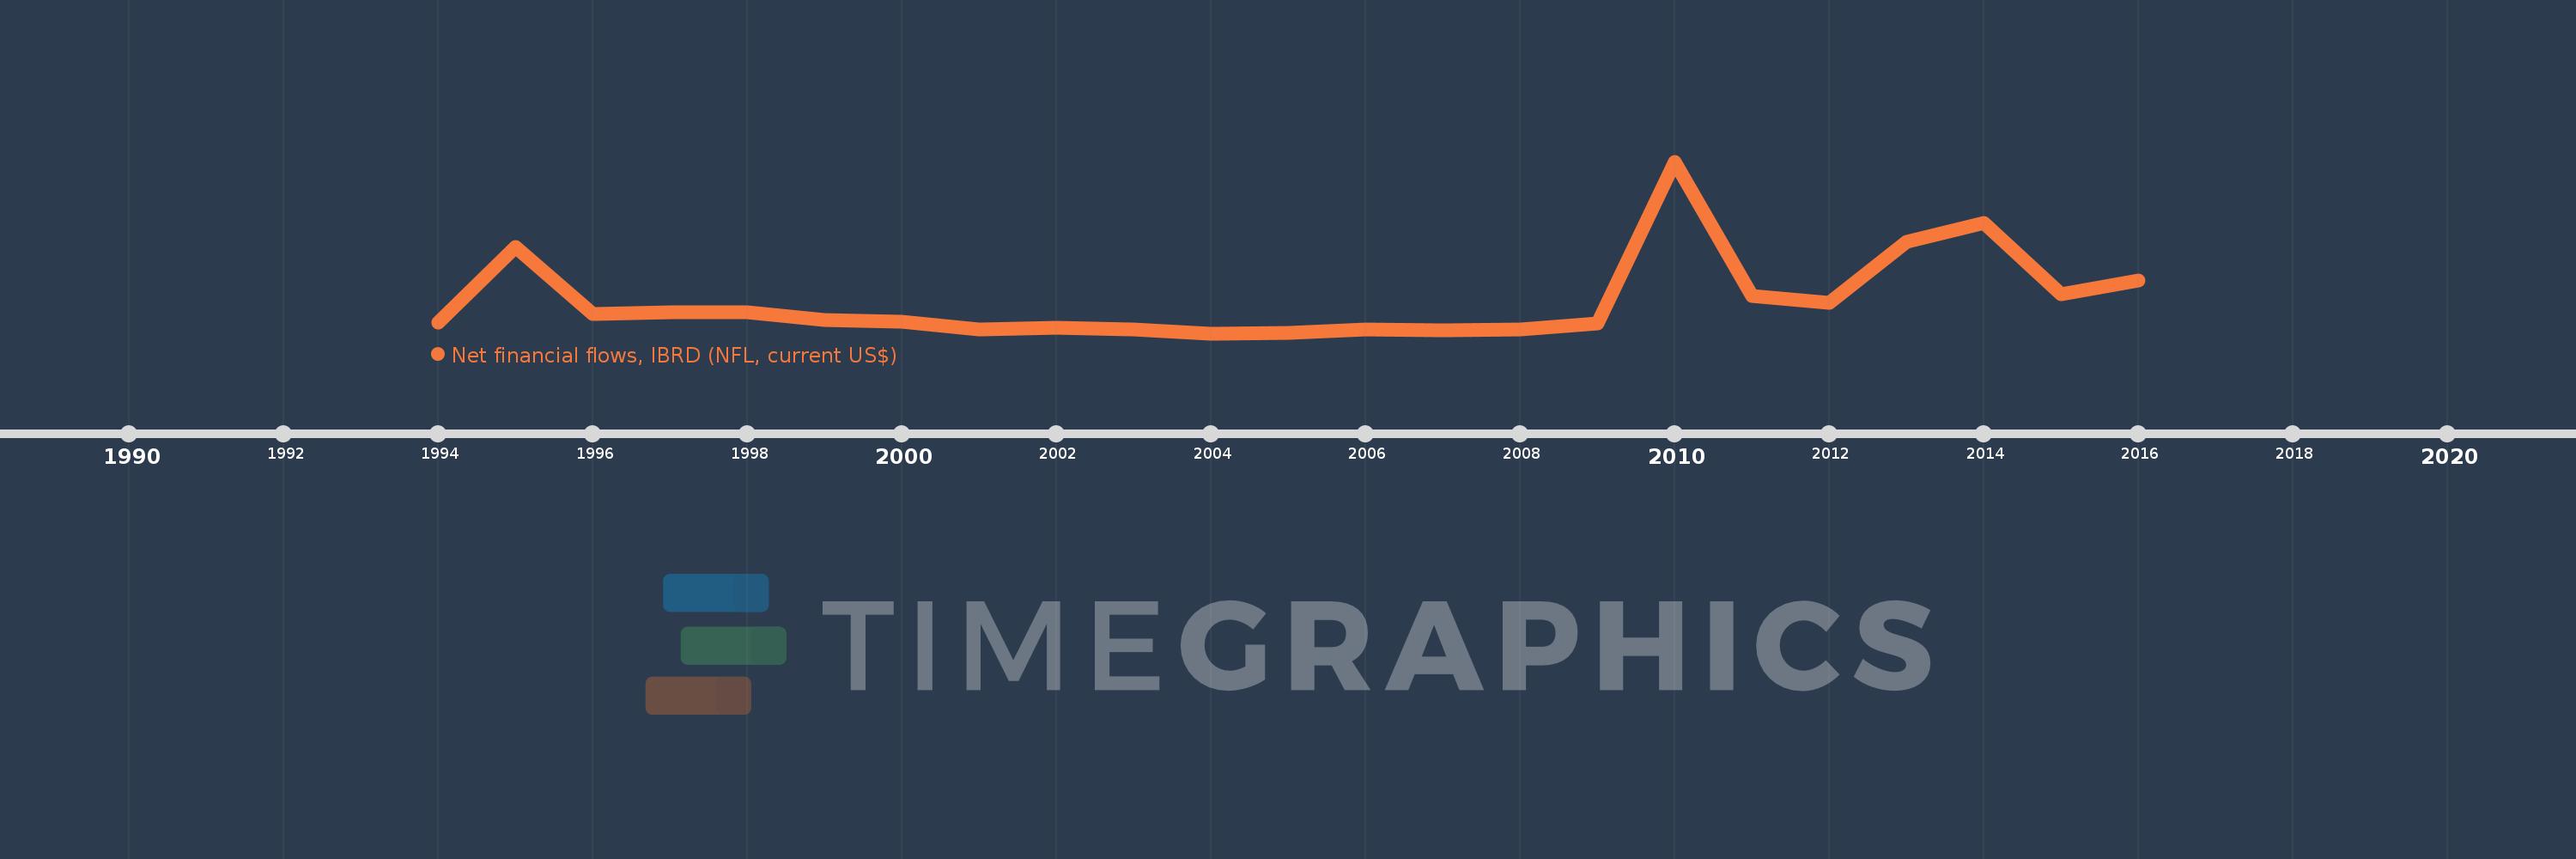
Net financial flows, IBRD (NFL, current US$)
2016,2015,2014,2013,2012,2011,2010,2009,2008,2007,2006,2005,2004,2003,2002,2001,2000,1999,1998,1997,1996,1995,1994
This statistics in other country:
Timeline:
This timeline shows a graph from 1994 to 2016 of Belarus. No data until 1993. Number of actual observations by date: 23.
Source name:
World Development Indicators
Source organization:
World Bank, International Debt Statistics.
Categories, topics:
External Debt
Last updated:
apr 23, 2017
Indicators value changes by year
Minimum:
-14.348 mln
jan 1, 2004
Maximum:
213.481 mln
jan 1, 2010
At the date of observation
Value
Absolute change
Change from previous value
jan 1, 1994
100.0K
+100.0K
0.0%
jan 1, 1995
100.142 mln
+100.042 mln
100.04K%
jan 1, 1996
11.228 mln
-88.914 mln
-88.79%
jan 1, 1997
13.881 mln
+2.653 mln
23.63%
jan 1, 1998
13.343 mln
-538.0K
-3.88%
jan 1, 1999
3.567 mln
-9.776 mln
-73.27%
jan 1, 2000
1.267 mln
-2.3 mln
-64.48%
jan 1, 2001
-8.754 mln
-10.021 mln
-790.92%
jan 1, 2002
-7.325 mln
+1.429 mln
-16.32%
jan 1, 2003
-9.788 mln
-2.463 mln
33.62%
jan 1, 2004
-14.348 mln
-4.56 mln
46.59%
jan 1, 2005
-13.512 mln
+836.0K
-5.83%
jan 1, 2006
-8.925 mln
+4.587 mln
-33.95%
jan 1, 2007
-10.284 mln
-1.359 mln
15.23%
jan 1, 2008
-8.669 mln
+1.615 mln
-15.7%
jan 1, 2009
-866.0K
+7.803 mln
-90.01%
jan 1, 2010
213.481 mln
+214.347 mln
-24.75K%
jan 1, 2011
35.705 mln
-177.776 mln
-83.27%
jan 1, 2012
26.212 mln
-9.493 mln
-26.59%
jan 1, 2013
106.78 mln
+80.568 mln
307.37%
jan 1, 2014
132.329 mln
+25.549 mln
23.93%
jan 1, 2015
37.261 mln
-95.068 mln
-71.84%
jan 1, 2016
56.261 mln
+19.0 mln
50.99%
Ranking of countries by current statistics by years


Comments: