29
/
en
AIzaSyAYiBZKx7MnpbEhh9jyipgxe19OcubqV5w
April 1, 2024
48381
Middle East & North Africa
MEA
false
2
1
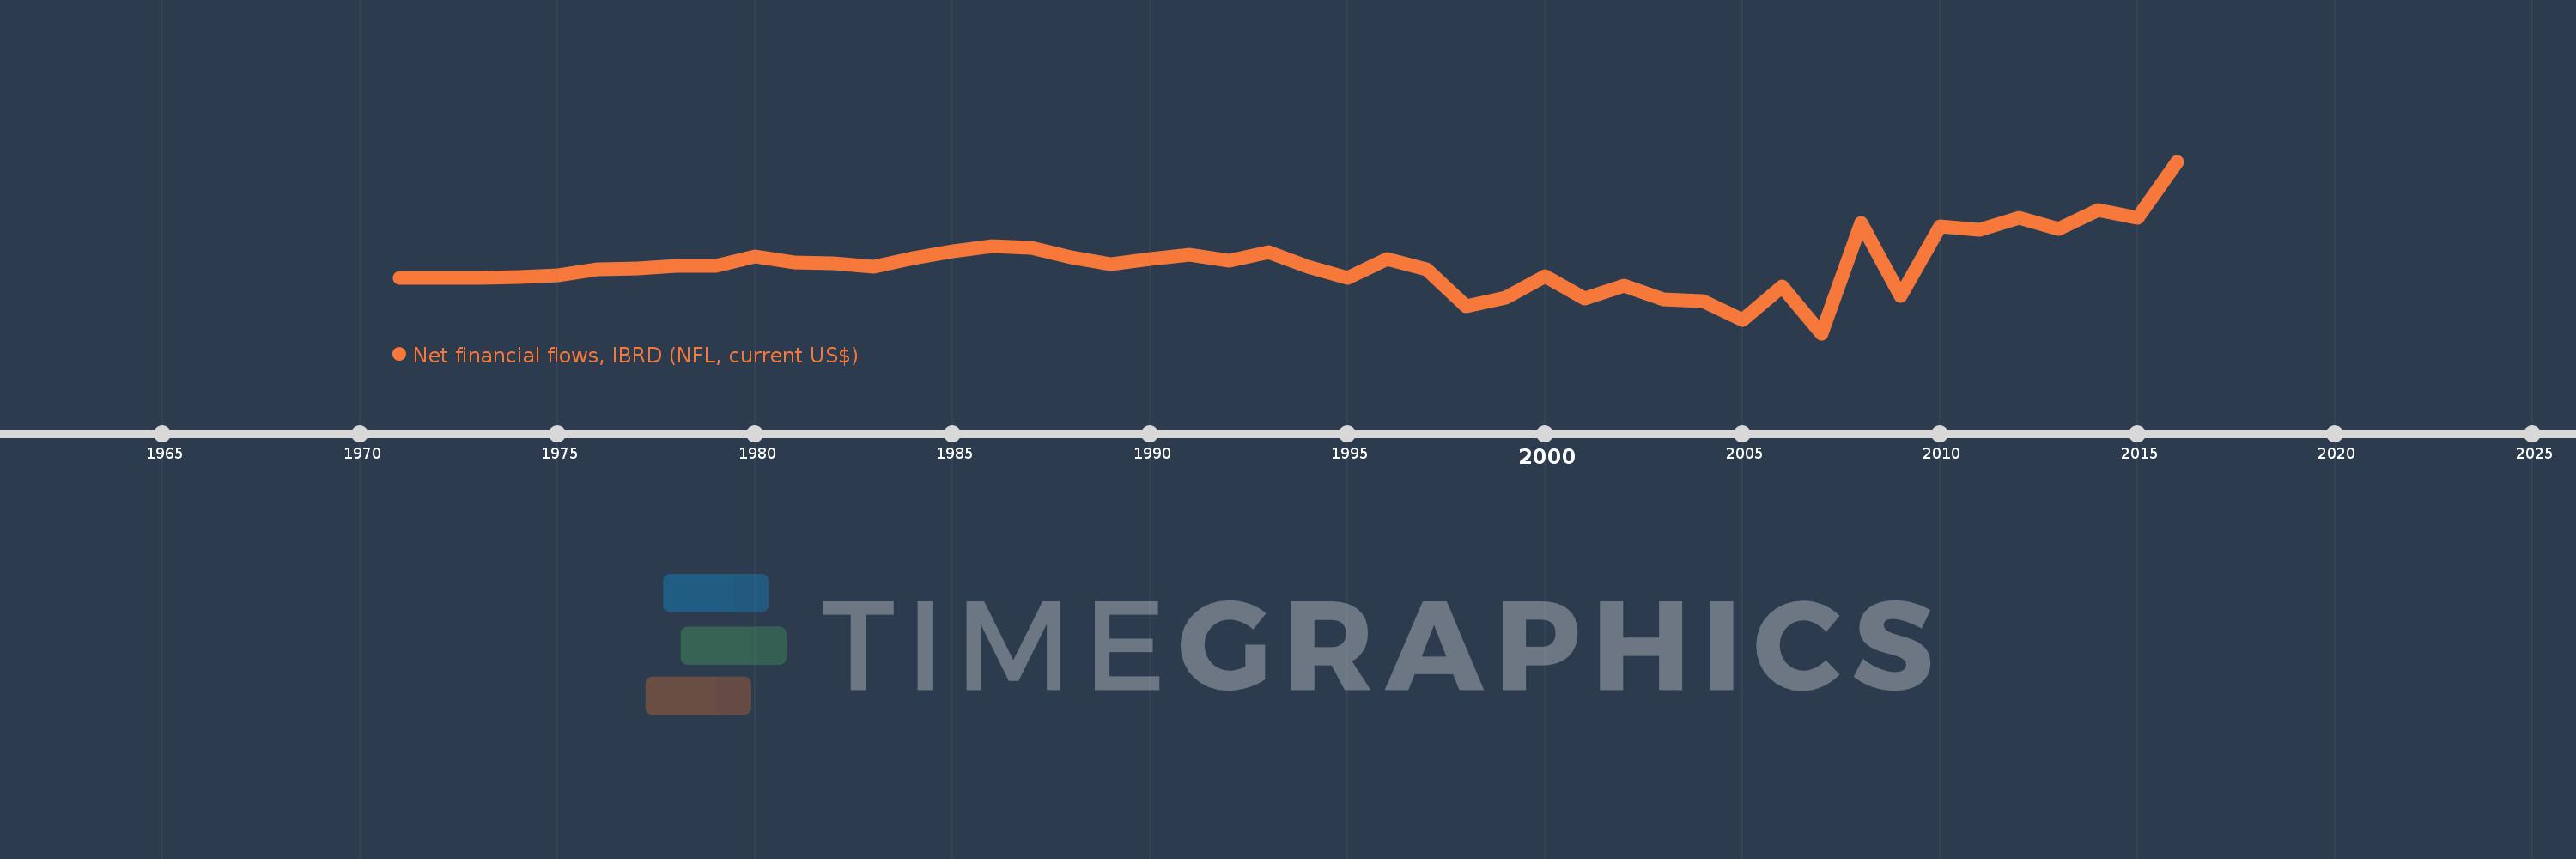
Net financial flows, IBRD (NFL, current US$)
2016,2015,2014,2013,2012,2011,2010,2009,2008,2007,2006,2005,2004,2003,2002,2001,2000,1999,1998,1997,1996,1995,1994,1993,1992,1991,1990,1989,1988,1987,1986,1985,1984,1983,1982,1981,1980,1979,1978,1977,1976,1975,1974,1973,1972,1971
This statistics in other country:
Timeline:
This timeline shows a graph from 1971 to 2016 of Middle East & North Africa. No data until 1970. Number of actual observations by date: 46.
Source name:
World Development Indicators
Source organization:
World Bank, International Debt Statistics.
Categories, topics:
External Debt
Last updated:
apr 23, 2017
Indicators value changes by year
Minimum:
-933.981 mln
jan 1, 2007
Maximum:
2.001 bln
jan 1, 2016
At the date of observation
Value
Absolute change
Change from previous value
jan 1, 1971
7.547 mln
+7.547 mln
0.0%
jan 1, 1972
18.229 mln
+10.682 mln
141.54%
jan 1, 1973
17.251 mln
-978.0K
-5.37%
jan 1, 1974
28.288 mln
+11.037 mln
63.98%
jan 1, 1975
56.241 mln
+27.953 mln
98.82%
jan 1, 1976
161.988 mln
+105.747 mln
188.02%
jan 1, 1977
168.233 mln
+6.245 mln
3.86%
jan 1, 1978
223.109 mln
+54.876 mln
32.62%
jan 1, 1979
214.031 mln
-9.078 mln
-4.07%
jan 1, 1980
380.669 mln
+166.638 mln
77.86%
jan 1, 1981
281.011 mln
-99.658 mln
-26.18%
jan 1, 1982
260.818 mln
-20.193 mln
-7.19%
jan 1, 1983
205.858 mln
-54.96 mln
-21.07%
jan 1, 1984
354.332 mln
+148.474 mln
72.12%
jan 1, 1985
472.27 mln
+117.938 mln
33.28%
jan 1, 1986
550.233 mln
+77.963 mln
16.51%
jan 1, 1987
521.361 mln
-28.873 mln
-5.25%
jan 1, 1988
371.331 mln
-150.029 mln
-28.78%
jan 1, 1989
251.338 mln
-119.993 mln
-32.31%
jan 1, 1990
342.286 mln
+90.947 mln
36.19%
jan 1, 1991
402.573 mln
+60.287 mln
17.61%
jan 1, 1992
299.01 mln
-103.563 mln
-25.73%
jan 1, 1993
451.895 mln
+152.885 mln
51.13%
jan 1, 1994
200.198 mln
-251.697 mln
-55.7%
jan 1, 1995
9.56 mln
-190.639 mln
-95.22%
jan 1, 1996
336.932 mln
+327.372 mln
3.42K%
jan 1, 1997
159.517 mln
-177.415 mln
-52.66%
jan 1, 1998
-478.192 mln
-637.709 mln
-399.78%
jan 1, 1999
-325.396 mln
+152.796 mln
-31.95%
jan 1, 2000
45.705 mln
+371.101 mln
-114.05%
jan 1, 2001
-339.186 mln
-384.891 mln
-842.12%
jan 1, 2002
-124.715 mln
+214.47 mln
-63.23%
jan 1, 2003
-352.801 mln
-228.086 mln
182.89%
jan 1, 2004
-381.167 mln
-28.366 mln
8.04%
jan 1, 2005
-709.236 mln
-328.069 mln
86.07%
jan 1, 2006
-135.496 mln
+573.74 mln
-80.9%
jan 1, 2007
-933.981 mln
-798.485 mln
589.31%
jan 1, 2008
952.025 mln
+1.886 bln
-201.93%
jan 1, 2009
-302.842 mln
-1.255 bln
-131.81%
jan 1, 2010
894.213 mln
+1.197 bln
-395.27%
jan 1, 2011
837.331 mln
-56.882 mln
-6.36%
jan 1, 2012
1.034 bln
+196.415 mln
23.46%
jan 1, 2013
845.63 mln
-188.116 mln
-18.2%
jan 1, 2014
1.178 bln
+332.772 mln
39.35%
jan 1, 2015
1.034 bln
-143.958 mln
-12.22%
jan 1, 2016
2.001 bln
+966.956 mln
93.48%
Ranking of countries by current statistics by years


Comments: