29
/
en
AIzaSyAYiBZKx7MnpbEhh9jyipgxe19OcubqV5w
April 1, 2024
269710
Turkey
TUR
true
2
1
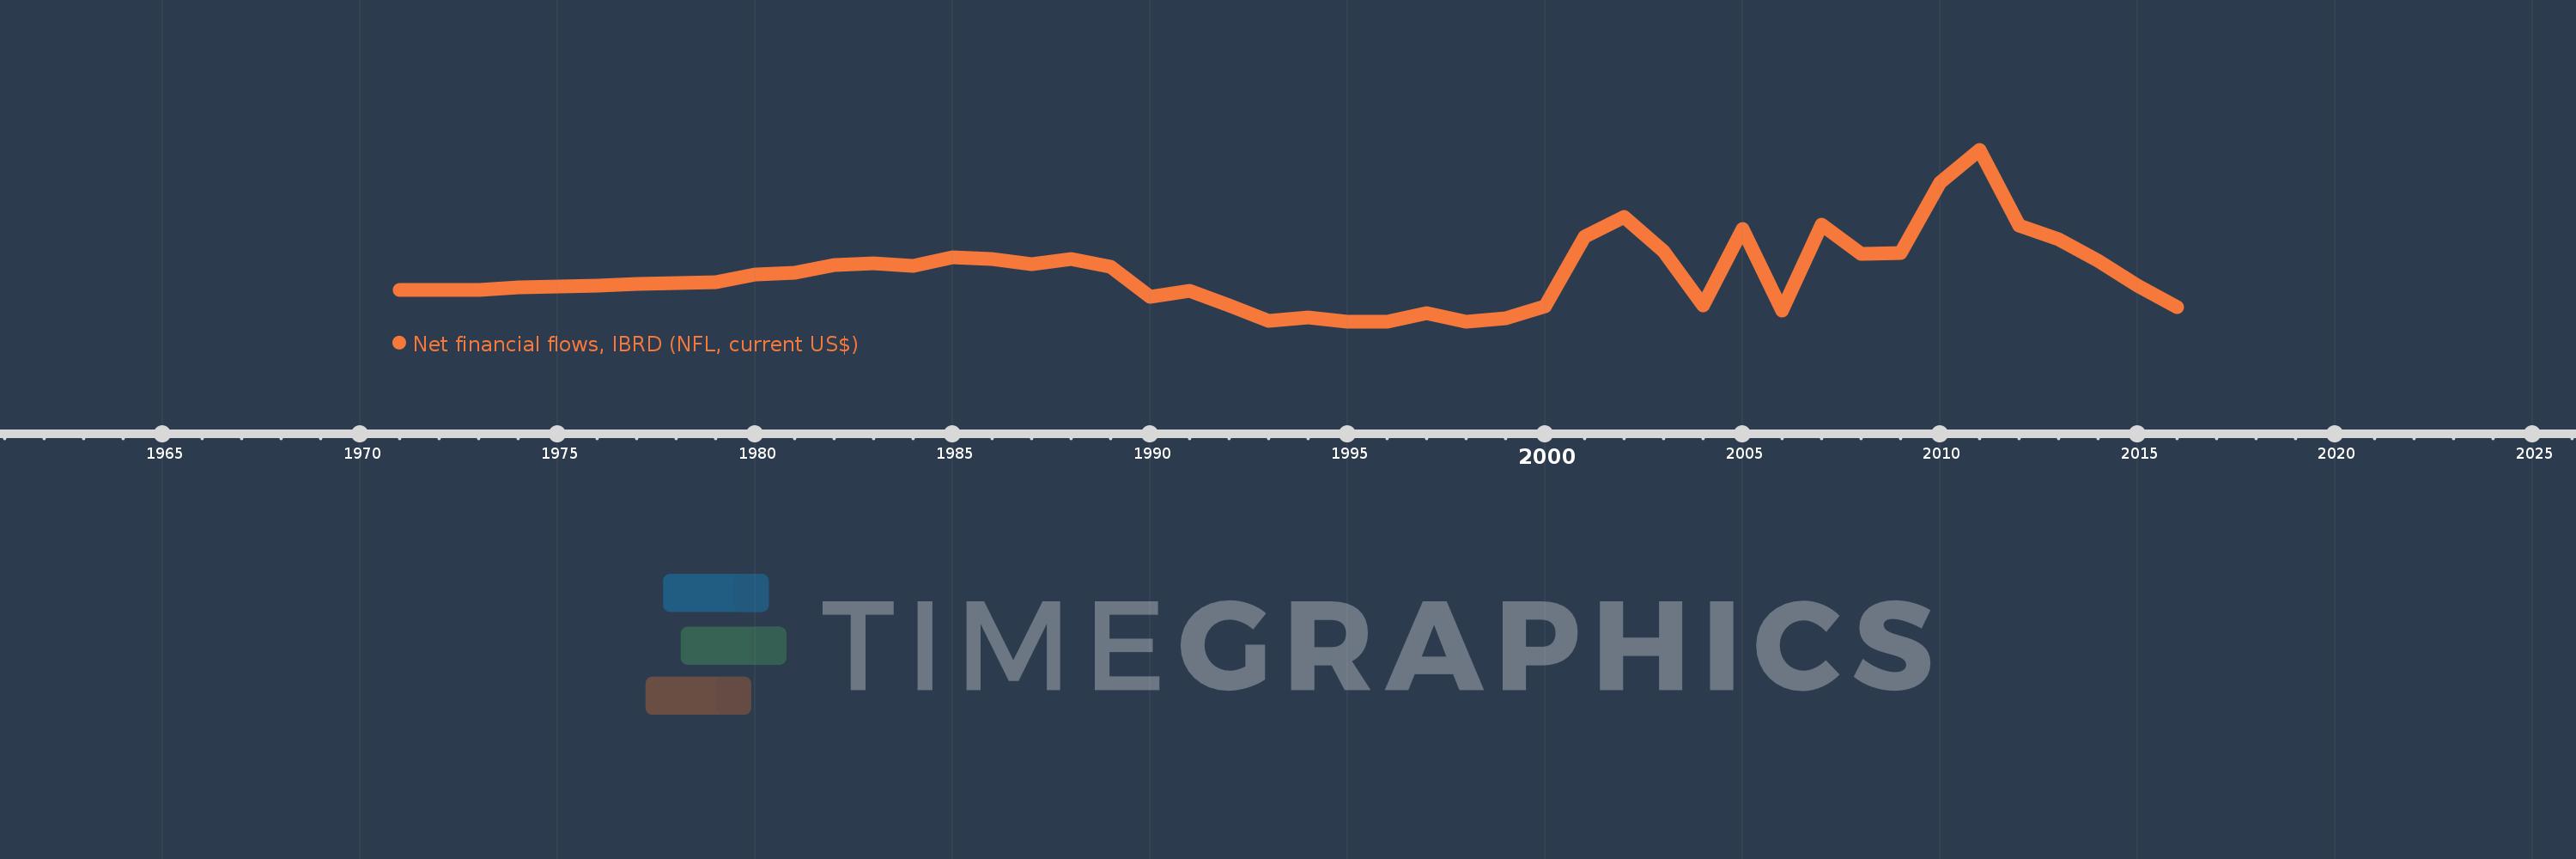
Net financial flows, IBRD (NFL, current US$)
2016,2015,2014,2013,2012,2011,2010,2009,2008,2007,2006,2005,2004,2003,2002,2001,2000,1999,1998,1997,1996,1995,1994,1993,1992,1991,1990,1989,1988,1987,1986,1985,1984,1983,1982,1981,1980,1979,1978,1977,1976,1975,1974,1973,1972,1971
This statistics in other country:
Timeline:
This timeline shows a graph from 1971 to 2016 of Turkey. No data until 1970. Number of actual observations by date: 46.
Source name:
World Development Indicators
Source organization:
World Bank, International Debt Statistics.
Categories, topics:
External Debt
Last updated:
apr 23, 2017
Indicators value changes by year
Minimum:
-460.576 mln
jan 1, 1998
Maximum:
2.094 bln
jan 1, 2011
At the date of observation
Value
Absolute change
Change from previous value
jan 1, 1971
14.59 mln
+14.59 mln
0.0%
jan 1, 1972
18.792 mln
+4.202 mln
28.8%
jan 1, 1973
19.56 mln
+768.0K
4.09%
jan 1, 1974
49.177 mln
+29.617 mln
151.42%
jan 1, 1975
67.047 mln
+17.87 mln
36.34%
jan 1, 1976
79.808 mln
+12.761 mln
19.03%
jan 1, 1977
103.446 mln
+23.638 mln
29.62%
jan 1, 1978
120.31 mln
+16.864 mln
16.3%
jan 1, 1979
136.076 mln
+15.766 mln
13.1%
jan 1, 1980
242.341 mln
+106.265 mln
78.09%
jan 1, 1981
267.466 mln
+25.125 mln
10.37%
jan 1, 1982
390.857 mln
+123.391 mln
46.13%
jan 1, 1983
416.381 mln
+25.524 mln
6.53%
jan 1, 1984
373.886 mln
-42.495 mln
-10.21%
jan 1, 1985
502.498 mln
+128.612 mln
34.4%
jan 1, 1986
480.638 mln
-21.86 mln
-4.35%
jan 1, 1987
401.025 mln
-79.613 mln
-16.56%
jan 1, 1988
471.15 mln
+70.125 mln
17.49%
jan 1, 1989
360.276 mln
-110.874 mln
-23.53%
jan 1, 1990
-81.935 mln
-442.211 mln
-122.74%
jan 1, 1991
6.233 mln
+88.168 mln
-107.61%
jan 1, 1992
-215.083 mln
-221.316 mln
-3.55K%
jan 1, 1993
-441.923 mln
-226.84 mln
105.47%
jan 1, 1994
-393.523 mln
+48.4 mln
-10.95%
jan 1, 1995
-457.245 mln
-63.722 mln
16.19%
jan 1, 1996
-459.718 mln
-2.473 mln
0.54%
jan 1, 1997
-325.868 mln
+133.85 mln
-29.12%
jan 1, 1998
-460.576 mln
-134.708 mln
41.34%
jan 1, 1999
-407.738 mln
+52.838 mln
-11.47%
jan 1, 2000
-233.18 mln
+174.558 mln
-42.81%
jan 1, 2001
805.821 mln
+1.039 bln
-445.58%
jan 1, 2002
1.106 bln
+299.868 mln
37.21%
jan 1, 2003
594.316 mln
-511.373 mln
-46.25%
jan 1, 2004
-220.216 mln
-814.532 mln
-137.05%
jan 1, 2005
919.467 mln
+1.14 bln
-517.53%
jan 1, 2006
-294.024 mln
-1.213 bln
-131.98%
jan 1, 2007
989.093 mln
+1.283 bln
-436.4%
jan 1, 2008
557.13 mln
-431.963 mln
-43.67%
jan 1, 2009
570.016 mln
+12.886 mln
2.31%
jan 1, 2010
1.619 bln
+1.049 bln
184.04%
jan 1, 2011
2.094 bln
+475.236 mln
29.35%
jan 1, 2012
970.218 mln
-1.124 bln
-53.67%
jan 1, 2013
764.646 mln
-205.572 mln
-21.19%
jan 1, 2014
456.21 mln
-308.436 mln
-40.34%
jan 1, 2015
82.634 mln
-373.576 mln
-81.89%
jan 1, 2016
-236.67 mln
-319.304 mln
-386.41%
Ranking of countries by current statistics by years


Comments: