29
/
en
AIzaSyAYiBZKx7MnpbEhh9jyipgxe19OcubqV5w
April 1, 2024
156368
Indonesia
IDN
true
2
1
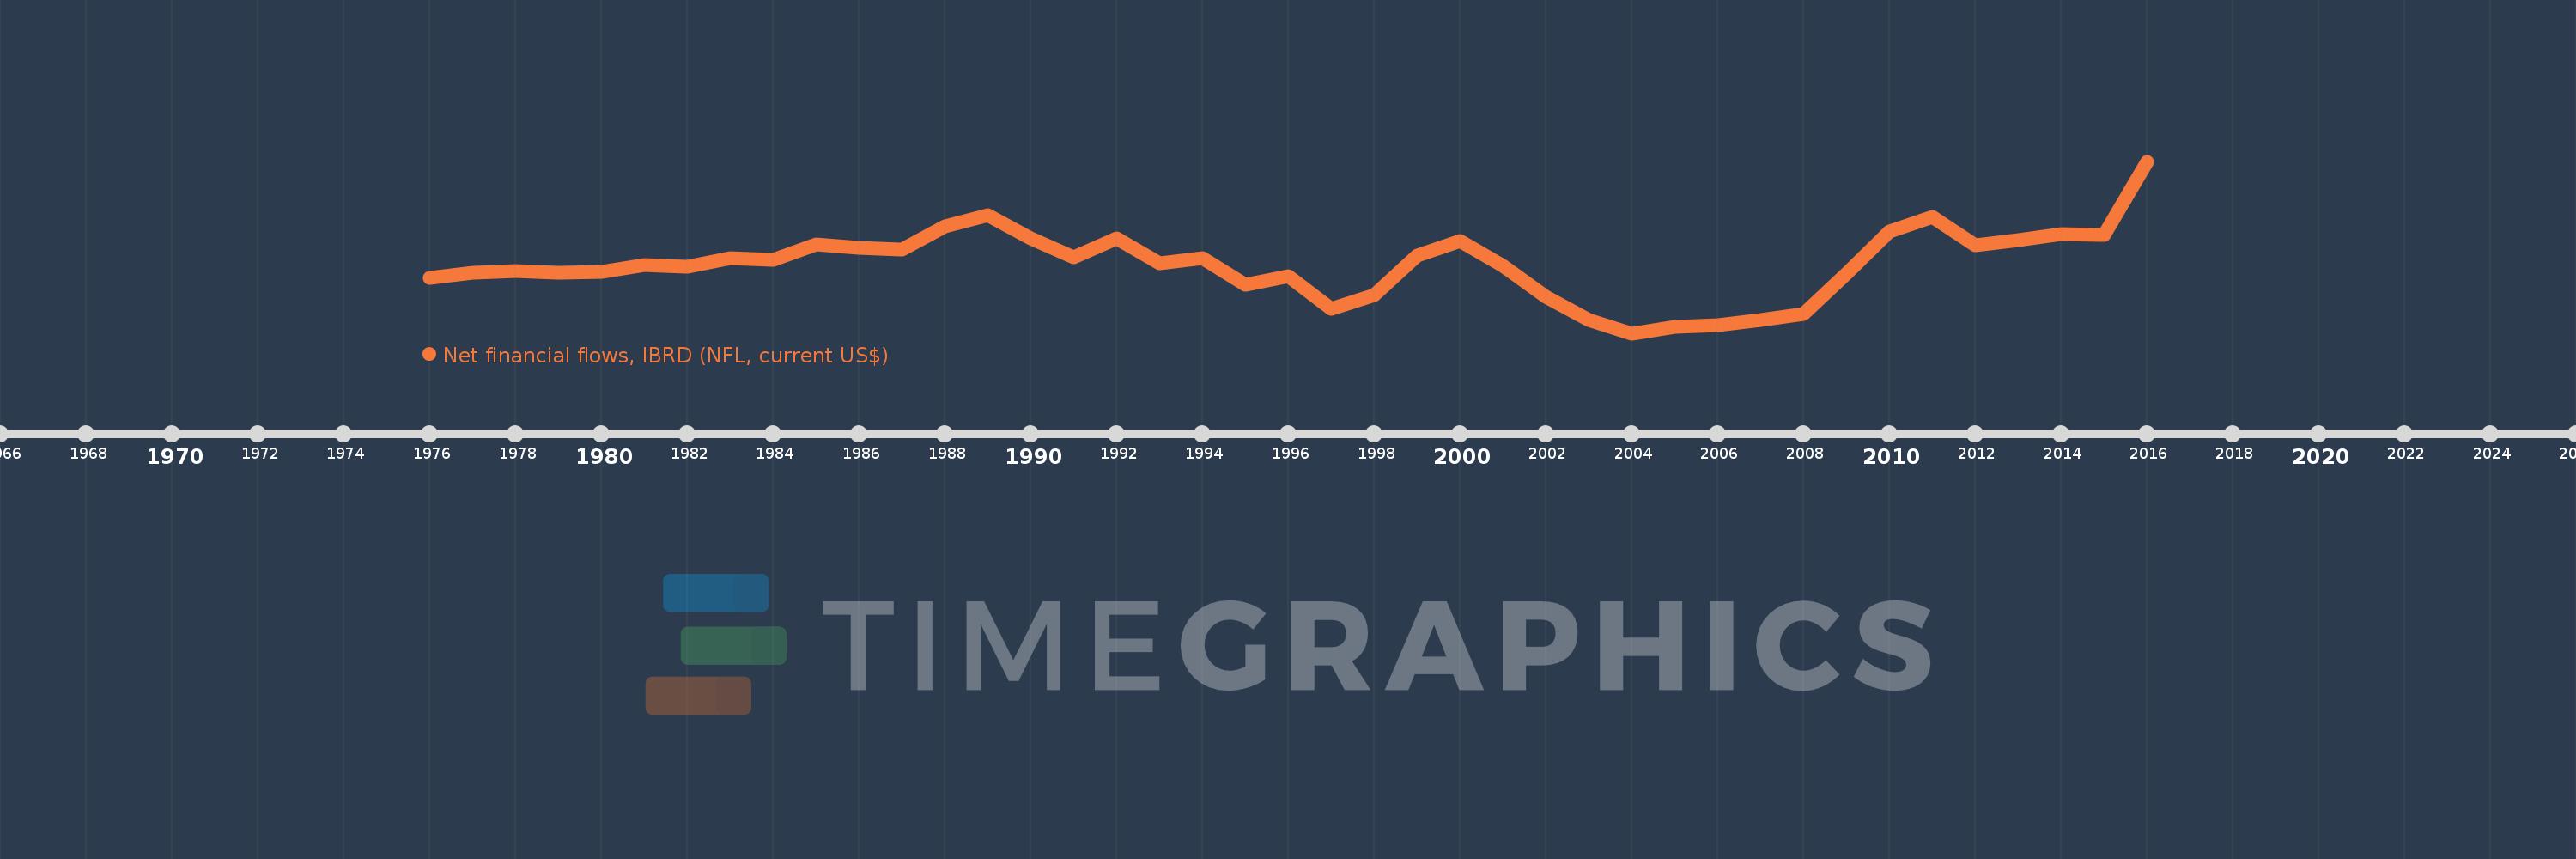
Net financial flows, IBRD (NFL, current US$)
2016,2015,2014,2013,2012,2011,2010,2009,2008,2007,2006,2005,2004,2003,2002,2001,2000,1999,1998,1997,1996,1995,1994,1993,1992,1991,1990,1989,1988,1987,1986,1985,1984,1983,1982,1981,1980,1979,1978,1977,1976
This statistics in other country:
Timeline:
This timeline shows a graph from 1976 to 2016 of Indonesia. No data until 1975. Number of actual observations by date: 41.
Source name:
World Development Indicators
Source organization:
World Bank, International Debt Statistics.
Categories, topics:
External Debt
Last updated:
apr 23, 2017
Indicators value changes by year
Minimum:
-949.98 mln
jan 1, 2004
Maximum:
2.194 bln
jan 1, 2016
At the date of observation
Value
Absolute change
Change from previous value
jan 1, 1976
56.808 mln
+56.808 mln
0.0%
jan 1, 1977
156.366 mln
+99.558 mln
175.25%
jan 1, 1978
189.141 mln
+32.775 mln
20.96%
jan 1, 1979
161.16 mln
-27.981 mln
-14.79%
jan 1, 1980
175.585 mln
+14.425 mln
8.95%
jan 1, 1981
300.629 mln
+125.044 mln
71.22%
jan 1, 1982
269.011 mln
-31.618 mln
-10.52%
jan 1, 1983
425.884 mln
+156.873 mln
58.31%
jan 1, 1984
401.798 mln
-24.086 mln
-5.66%
jan 1, 1985
672.843 mln
+271.045 mln
67.46%
jan 1, 1986
611.339 mln
-61.504 mln
-9.14%
jan 1, 1987
579.526 mln
-31.813 mln
-5.2%
jan 1, 1988
1.004 bln
+424.609 mln
73.27%
jan 1, 1989
1.219 bln
+215.06 mln
21.42%
jan 1, 1990
783.428 mln
-435.767 mln
-35.74%
jan 1, 1991
436.363 mln
-347.065 mln
-44.3%
jan 1, 1992
790.016 mln
+353.653 mln
81.05%
jan 1, 1993
326.56 mln
-463.456 mln
-58.66%
jan 1, 1994
430.382 mln
+103.822 mln
31.79%
jan 1, 1995
-55.577 mln
-485.959 mln
-112.91%
jan 1, 1996
89.803 mln
+145.38 mln
-261.58%
jan 1, 1997
-503.056 mln
-592.859 mln
-660.18%
jan 1, 1998
-245.178 mln
+257.878 mln
-51.26%
jan 1, 1999
479.068 mln
+724.246 mln
-295.4%
jan 1, 2000
732.703 mln
+253.635 mln
52.94%
jan 1, 2001
290.148 mln
-442.555 mln
-60.4%
jan 1, 2002
-280.029 mln
-570.177 mln
-196.51%
jan 1, 2003
-706.026 mln
-425.997 mln
152.13%
jan 1, 2004
-949.98 mln
-243.954 mln
34.55%
jan 1, 2005
-825.623 mln
+124.357 mln
-13.09%
jan 1, 2006
-805.217 mln
+20.406 mln
-2.47%
jan 1, 2007
-706.386 mln
+98.831 mln
-12.27%
jan 1, 2008
-601.474 mln
+104.912 mln
-14.85%
jan 1, 2009
146.688 mln
+748.162 mln
-124.39%
jan 1, 2010
908.567 mln
+761.879 mln
519.39%
jan 1, 2011
1.177 bln
+268.819 mln
29.59%
jan 1, 2012
663.551 mln
-513.835 mln
-43.64%
jan 1, 2013
750.409 mln
+86.858 mln
13.09%
jan 1, 2014
871.362 mln
+120.953 mln
16.12%
jan 1, 2015
844.641 mln
-26.721 mln
-3.07%
jan 1, 2016
2.194 bln
+1.349 bln
159.74%
Ranking of countries by current statistics by years


Comments: