29
/
en
AIzaSyAYiBZKx7MnpbEhh9jyipgxe19OcubqV5w
April 1, 2024
55747
Pre-demographic dividend
PRE
false
2
1
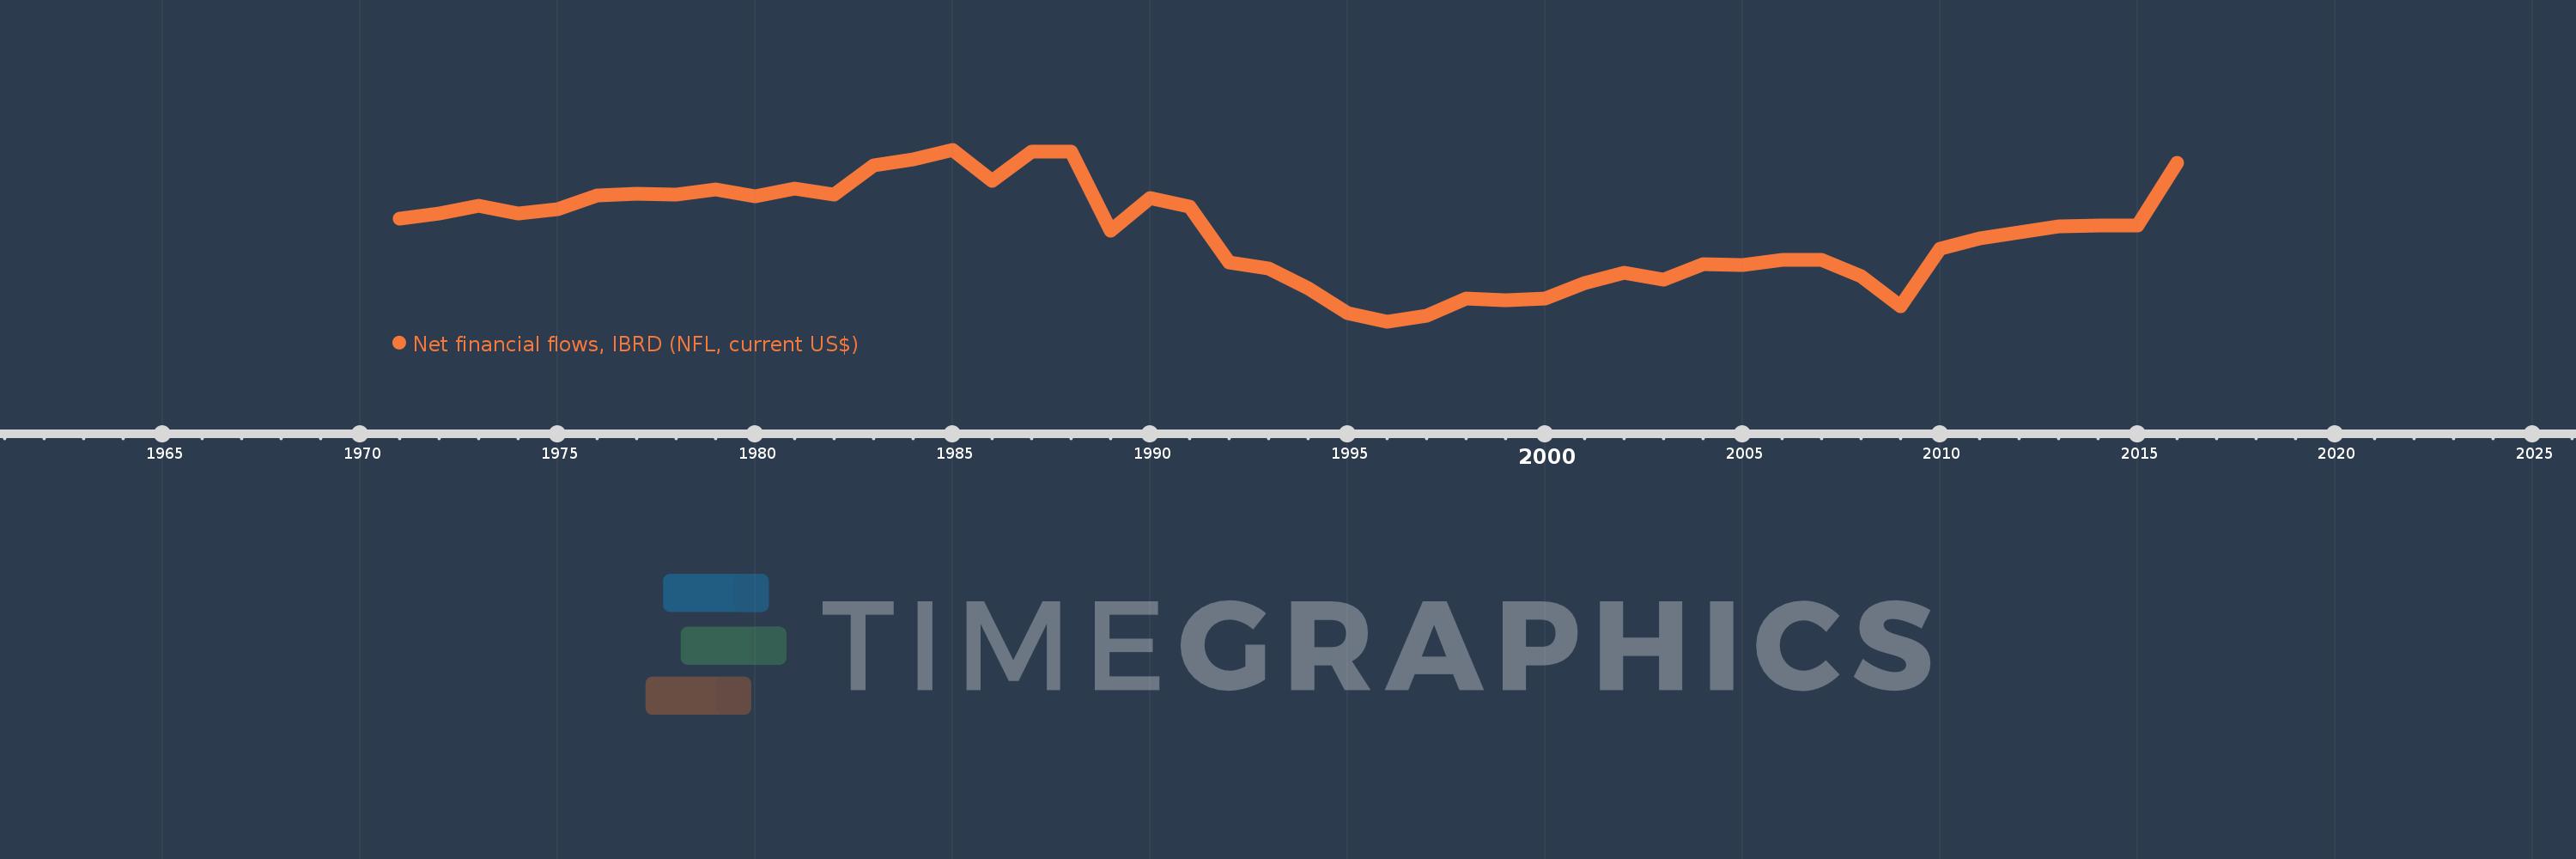
Net financial flows, IBRD (NFL, current US$)
2016,2015,2014,2013,2012,2011,2010,2009,2008,2007,2006,2005,2004,2003,2002,2001,2000,1999,1998,1997,1996,1995,1994,1993,1992,1991,1990,1989,1988,1987,1986,1985,1984,1983,1982,1981,1980,1979,1978,1977,1976,1975,1974,1973,1972,1971
This statistics in other country:
Timeline:
This timeline shows a graph from 1971 to 2016 of Pre-demographic dividend. No data until 1970. Number of actual observations by date: 46.
Source name:
World Development Indicators
Source organization:
World Bank, International Debt Statistics.
Categories, topics:
External Debt
Last updated:
apr 23, 2017
Indicators value changes by year
Minimum:
-711.039 mln
jan 1, 1996
Maximum:
548.921 mln
jan 1, 1985
At the date of observation
Value
Absolute change
Change from previous value
jan 1, 1971
49.122 mln
+49.122 mln
0.0%
jan 1, 1972
86.453 mln
+37.331 mln
76.0%
jan 1, 1973
139.516 mln
+53.063 mln
61.38%
jan 1, 1974
85.557 mln
-53.959 mln
-38.68%
jan 1, 1975
113.091 mln
+27.534 mln
32.18%
jan 1, 1976
215.881 mln
+102.79 mln
90.89%
jan 1, 1977
231.549 mln
+15.668 mln
7.26%
jan 1, 1978
222.144 mln
-9.405 mln
-4.06%
jan 1, 1979
260.332 mln
+38.188 mln
17.19%
jan 1, 1980
212.535 mln
-47.797 mln
-18.36%
jan 1, 1981
264.837 mln
+52.302 mln
24.61%
jan 1, 1982
223.773 mln
-41.064 mln
-15.51%
jan 1, 1983
437.918 mln
+214.145 mln
95.7%
jan 1, 1984
480.394 mln
+42.476 mln
9.7%
jan 1, 1985
548.921 mln
+68.527 mln
14.26%
jan 1, 1986
322.511 mln
-226.41 mln
-41.25%
jan 1, 1987
536.252 mln
+213.741 mln
66.27%
jan 1, 1988
539.942 mln
+3.69 mln
0.69%
jan 1, 1989
-40.481 mln
-580.423 mln
-107.5%
jan 1, 1990
195.644 mln
+236.125 mln
-583.3%
jan 1, 1991
134.408 mln
-61.236 mln
-31.3%
jan 1, 1992
-276.917 mln
-411.325 mln
-306.03%
jan 1, 1993
-321.484 mln
-44.567 mln
16.09%
jan 1, 1994
-463.769 mln
-142.285 mln
44.26%
jan 1, 1995
-646.411 mln
-182.642 mln
39.38%
jan 1, 1996
-711.039 mln
-64.628 mln
10.0%
jan 1, 1997
-668.194 mln
+42.845 mln
-6.03%
jan 1, 1998
-538.795 mln
+129.399 mln
-19.37%
jan 1, 1999
-552.996 mln
-14.201 mln
2.64%
jan 1, 2000
-536.853 mln
+16.143 mln
-2.92%
jan 1, 2001
-422.836 mln
+114.017 mln
-21.24%
jan 1, 2002
-348.778 mln
+74.058 mln
-17.51%
jan 1, 2003
-398.089 mln
-49.311 mln
14.14%
jan 1, 2004
-289.763 mln
+108.326 mln
-27.21%
jan 1, 2005
-293.079 mln
-3.316 mln
1.14%
jan 1, 2006
-258.193 mln
+34.886 mln
-11.9%
jan 1, 2007
-254.212 mln
+3.981 mln
-1.54%
jan 1, 2008
-378.212 mln
-124.0 mln
48.78%
jan 1, 2009
-597.333 mln
-219.121 mln
57.94%
jan 1, 2010
-174.795 mln
+422.538 mln
-70.74%
jan 1, 2011
-101.073 mln
+73.722 mln
-42.18%
jan 1, 2012
-56.913 mln
+44.16 mln
-43.69%
jan 1, 2013
-12.279 mln
+44.634 mln
-78.42%
jan 1, 2014
-5.335 mln
+6.944 mln
-56.55%
jan 1, 2015
-5.335 mln
0.0
0.0%
jan 1, 2016
454.264 mln
+459.599 mln
-8.61K%
Ranking of countries by current statistics by years


Comments: