29
/
en
AIzaSyAYiBZKx7MnpbEhh9jyipgxe19OcubqV5w
April 1, 2024
91526
Brazil
BRA
true
2
1
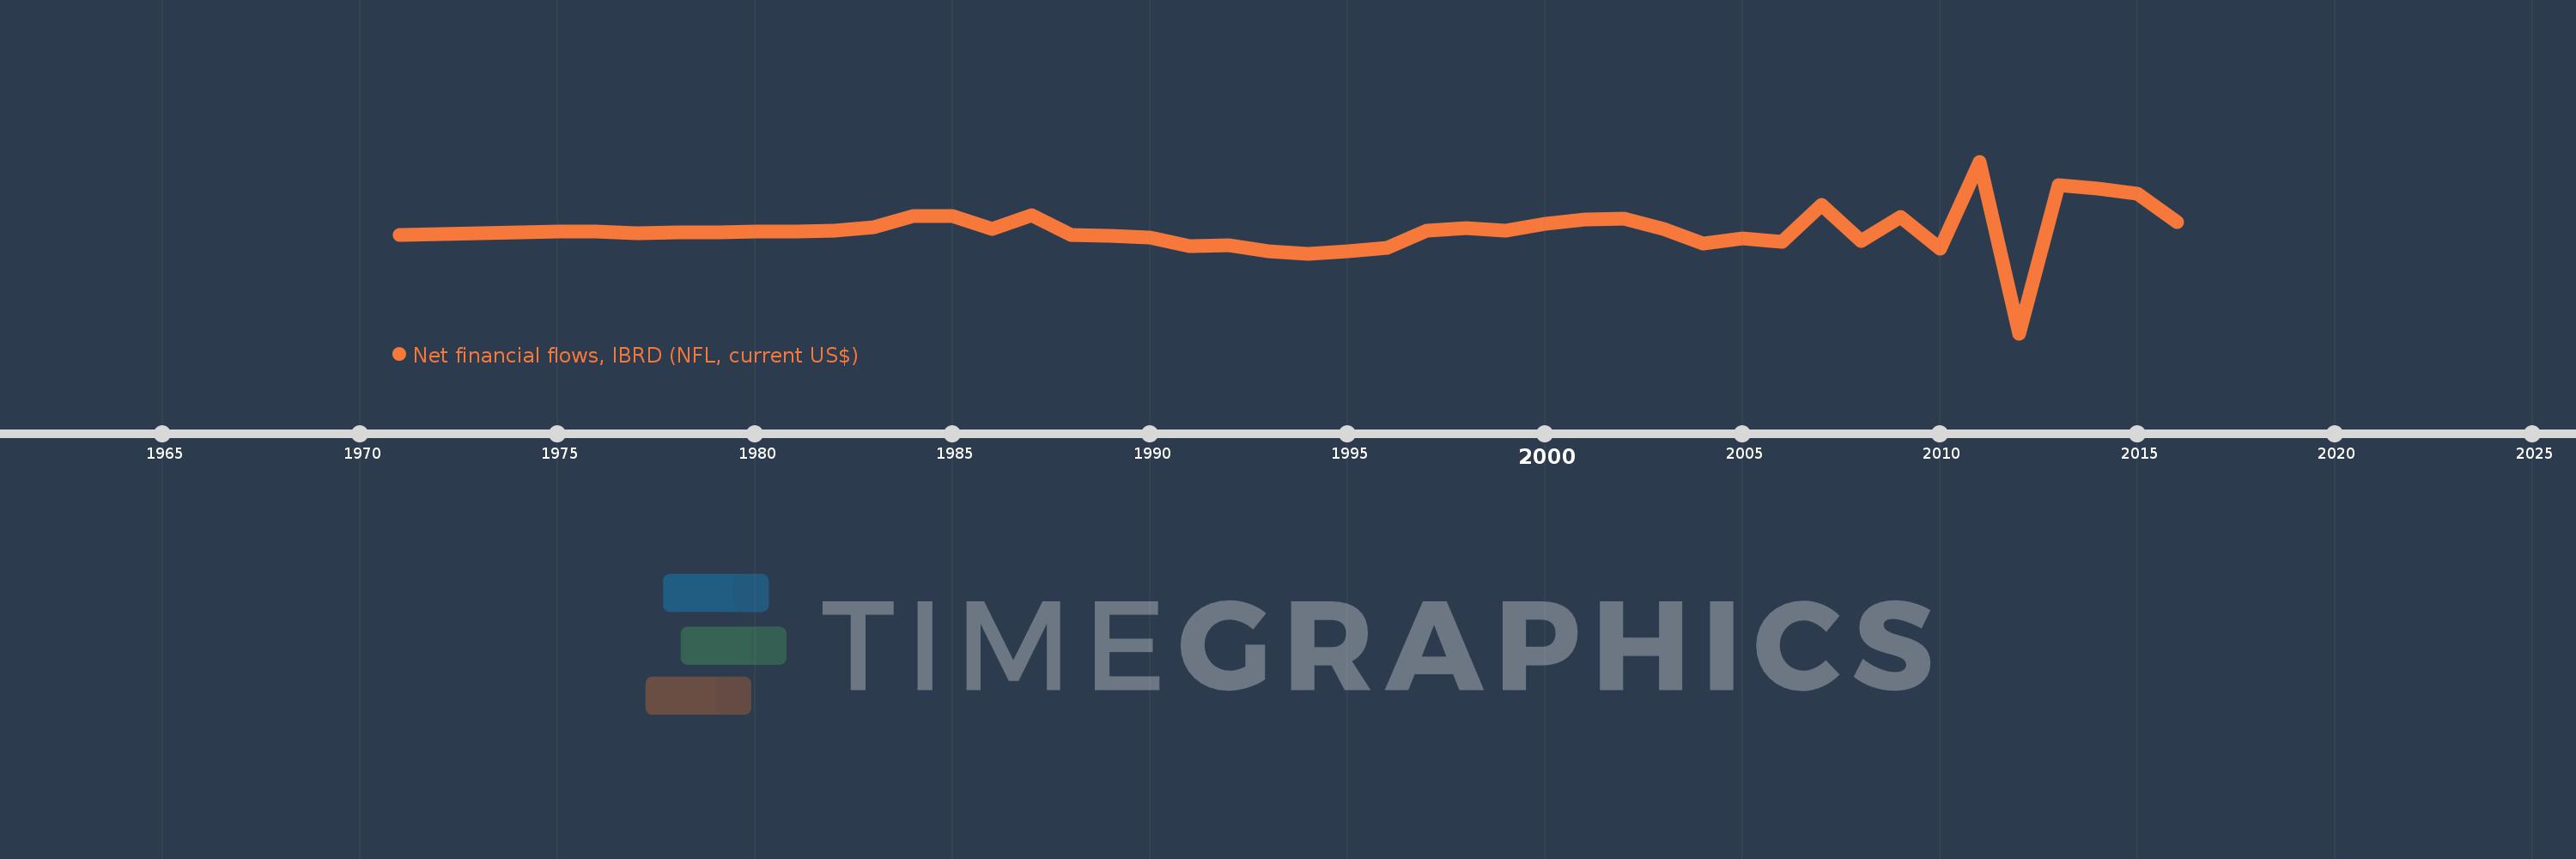
Net financial flows, IBRD (NFL, current US$)
2016,2015,2014,2013,2012,2011,2010,2009,2008,2007,2006,2005,2004,2003,2002,2001,2000,1999,1998,1997,1996,1995,1994,1993,1992,1991,1990,1989,1988,1987,1986,1985,1984,1983,1982,1981,1980,1979,1978,1977,1976,1975,1974,1973,1972,1971
This statistics in other country:
Timeline:
This timeline shows a graph from 1971 to 2016 of Brazil. No data until 1970. Number of actual observations by date: 46.
Source name:
World Development Indicators
Source organization:
World Bank, International Debt Statistics.
Categories, topics:
External Debt
Last updated:
apr 23, 2017
Indicators value changes by year
Minimum:
-4.553 bln
jan 1, 2012
Maximum:
3.512 bln
jan 1, 2011
At the date of observation
Value
Absolute change
Change from previous value
jan 1, 1971
46.914 mln
+46.914 mln
0.0%
jan 1, 1972
86.78 mln
+39.866 mln
84.98%
jan 1, 1973
138.199 mln
+51.419 mln
59.25%
jan 1, 1974
164.893 mln
+26.694 mln
19.32%
jan 1, 1975
225.445 mln
+60.552 mln
36.72%
jan 1, 1976
223.463 mln
-1.982 mln
-0.88%
jan 1, 1977
127.662 mln
-95.801 mln
-42.87%
jan 1, 1978
198.258 mln
+70.596 mln
55.3%
jan 1, 1979
191.031 mln
-7.227 mln
-3.65%
jan 1, 1980
227.735 mln
+36.704 mln
19.21%
jan 1, 1981
245.178 mln
+17.443 mln
7.66%
jan 1, 1982
251.184 mln
+6.006 mln
2.45%
jan 1, 1983
408.406 mln
+157.222 mln
62.59%
jan 1, 1984
933.944 mln
+525.538 mln
128.68%
jan 1, 1985
968.457 mln
+34.513 mln
3.7%
jan 1, 1986
359.208 mln
-609.249 mln
-62.91%
jan 1, 1987
1.011 bln
+651.926 mln
181.49%
jan 1, 1988
47.705 mln
-963.429 mln
-95.28%
jan 1, 1989
24.239 mln
-23.466 mln
-49.19%
jan 1, 1990
-52.14 mln
-76.379 mln
-315.11%
jan 1, 1991
-468.527 mln
-416.387 mln
798.59%
jan 1, 1992
-408.371 mln
+60.156 mln
-12.84%
jan 1, 1993
-684.727 mln
-276.356 mln
67.67%
jan 1, 1994
-807.706 mln
-122.979 mln
17.96%
jan 1, 1995
-705.64 mln
+102.066 mln
-12.64%
jan 1, 1996
-539.395 mln
+166.245 mln
-23.56%
jan 1, 1997
278.215 mln
+817.61 mln
-151.58%
jan 1, 1998
367.541 mln
+89.326 mln
32.11%
jan 1, 1999
245.522 mln
-122.019 mln
-33.2%
jan 1, 2000
580.355 mln
+334.833 mln
136.38%
jan 1, 2001
805.41 mln
+225.055 mln
38.78%
jan 1, 2002
810.245 mln
+4.835 mln
0.6%
jan 1, 2003
337.644 mln
-472.601 mln
-58.33%
jan 1, 2004
-342.026 mln
-679.67 mln
-201.3%
jan 1, 2005
-116.344 mln
+225.682 mln
-65.98%
jan 1, 2006
-255.394 mln
-139.05 mln
119.52%
jan 1, 2007
1.46 bln
+1.716 bln
-671.72%
jan 1, 2008
-198.596 mln
-1.659 bln
-113.6%
jan 1, 2009
914.23 mln
+1.113 bln
-560.35%
jan 1, 2010
-597.85 mln
-1.512 bln
-165.39%
jan 1, 2011
3.512 bln
+4.11 bln
-687.39%
jan 1, 2012
-4.553 bln
-8.065 bln
-229.65%
jan 1, 2013
2.409 bln
+6.962 bln
-152.91%
jan 1, 2014
2.259 bln
-150.037 mln
-6.23%
jan 1, 2015
1.998 bln
-261.247 mln
-11.57%
jan 1, 2016
659.579 mln
-1.338 bln
-66.98%
Ranking of countries by current statistics by years


Comments: