29
/
en
AIzaSyAYiBZKx7MnpbEhh9jyipgxe19OcubqV5w
April 1, 2024
34453
Fragile and conflict affected situations
FCS
false
2
1
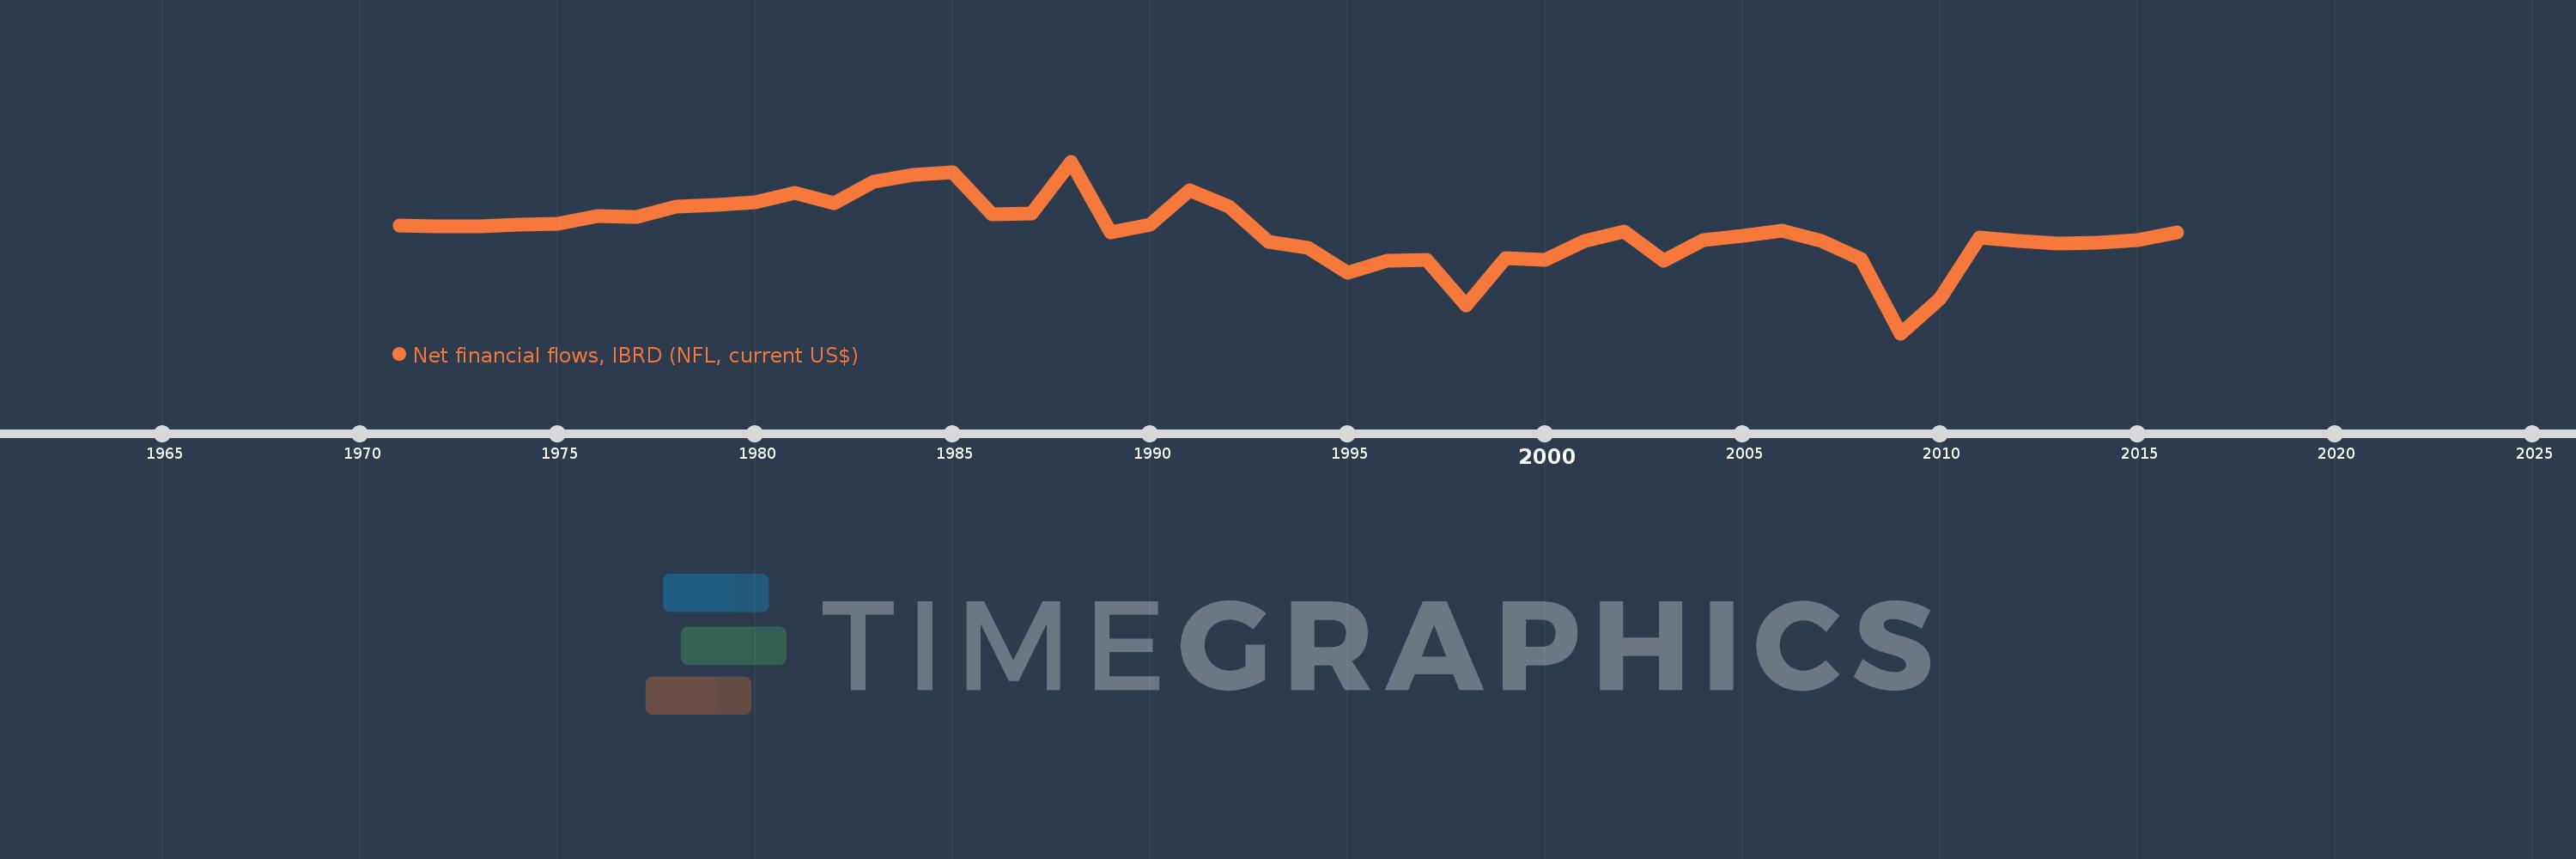
Net financial flows, IBRD (NFL, current US$)
2016,2015,2014,2013,2012,2011,2010,2009,2008,2007,2006,2005,2004,2003,2002,2001,2000,1999,1998,1997,1996,1995,1994,1993,1992,1991,1990,1989,1988,1987,1986,1985,1984,1983,1982,1981,1980,1979,1978,1977,1976,1975,1974,1973,1972,1971
This statistics in other country:
Timeline:
This timeline shows a graph from 1971 to 2016 of Fragile and conflict affected situations. No data until 1970. Number of actual observations by date: 46.
Source name:
World Development Indicators
Source organization:
World Bank, International Debt Statistics.
Categories, topics:
External Debt
Last updated:
apr 23, 2017
Indicators value changes by year
Minimum:
-504.458 mln
jan 1, 2009
Maximum:
317.781 mln
jan 1, 1988
At the date of observation
Value
Absolute change
Change from previous value
jan 1, 1971
11.236 mln
+11.236 mln
0.0%
jan 1, 1972
5.651 mln
-5.585 mln
-49.71%
jan 1, 1973
9.38 mln
+3.729 mln
65.99%
jan 1, 1974
14.125 mln
+4.745 mln
50.59%
jan 1, 1975
21.224 mln
+7.099 mln
50.26%
jan 1, 1976
57.087 mln
+35.863 mln
168.97%
jan 1, 1977
54.257 mln
-2.83 mln
-4.96%
jan 1, 1978
100.415 mln
+46.158 mln
85.07%
jan 1, 1979
108.141 mln
+7.726 mln
7.69%
jan 1, 1980
124.038 mln
+15.897 mln
14.7%
jan 1, 1981
169.066 mln
+45.028 mln
36.3%
jan 1, 1982
118.836 mln
-50.23 mln
-29.71%
jan 1, 1983
221.359 mln
+102.523 mln
86.27%
jan 1, 1984
253.263 mln
+31.904 mln
14.41%
jan 1, 1985
267.035 mln
+13.772 mln
5.44%
jan 1, 1986
63.006 mln
-204.029 mln
-76.41%
jan 1, 1987
69.183 mln
+6.177 mln
9.8%
jan 1, 1988
317.781 mln
+248.598 mln
359.33%
jan 1, 1989
-22.768 mln
-340.549 mln
-107.16%
jan 1, 1990
16.394 mln
+39.162 mln
-172.0%
jan 1, 1991
180.541 mln
+164.147 mln
1.0K%
jan 1, 1992
103.955 mln
-76.586 mln
-42.42%
jan 1, 1993
-64.662 mln
-168.617 mln
-162.2%
jan 1, 1994
-93.673 mln
-29.011 mln
44.87%
jan 1, 1995
-216.027 mln
-122.354 mln
130.62%
jan 1, 1996
-158.361 mln
+57.666 mln
-26.69%
jan 1, 1997
-153.786 mln
+4.575 mln
-2.89%
jan 1, 1998
-369.542 mln
-215.756 mln
140.3%
jan 1, 1999
-143.344 mln
+226.198 mln
-61.21%
jan 1, 2000
-153.074 mln
-9.73 mln
6.79%
jan 1, 2001
-61.143 mln
+91.931 mln
-60.06%
jan 1, 2002
-18.103 mln
+43.04 mln
-70.39%
jan 1, 2003
-155.805 mln
-137.702 mln
760.66%
jan 1, 2004
-60.399 mln
+95.406 mln
-61.23%
jan 1, 2005
-37.371 mln
+23.028 mln
-38.13%
jan 1, 2006
-12.659 mln
+24.712 mln
-66.13%
jan 1, 2007
-62.677 mln
-50.018 mln
395.12%
jan 1, 2008
-148.34 mln
-85.663 mln
136.67%
jan 1, 2009
-504.458 mln
-356.118 mln
240.07%
jan 1, 2010
-339.772 mln
+164.686 mln
-32.65%
jan 1, 2011
-46.771 mln
+293.001 mln
-86.23%
jan 1, 2012
-64.385 mln
-17.614 mln
37.66%
jan 1, 2013
-75.496 mln
-11.111 mln
17.26%
jan 1, 2014
-72.169 mln
+3.327 mln
-4.41%
jan 1, 2015
-57.012 mln
+15.157 mln
-21.0%
jan 1, 2016
-20.533 mln
+36.479 mln
-63.98%
Ranking of countries by current statistics by years


Comments: