29
/
en
AIzaSyAYiBZKx7MnpbEhh9jyipgxe19OcubqV5w
April 1, 2024
42698
Latin America & Caribbean (excluding high income)
LAC
false
2
1
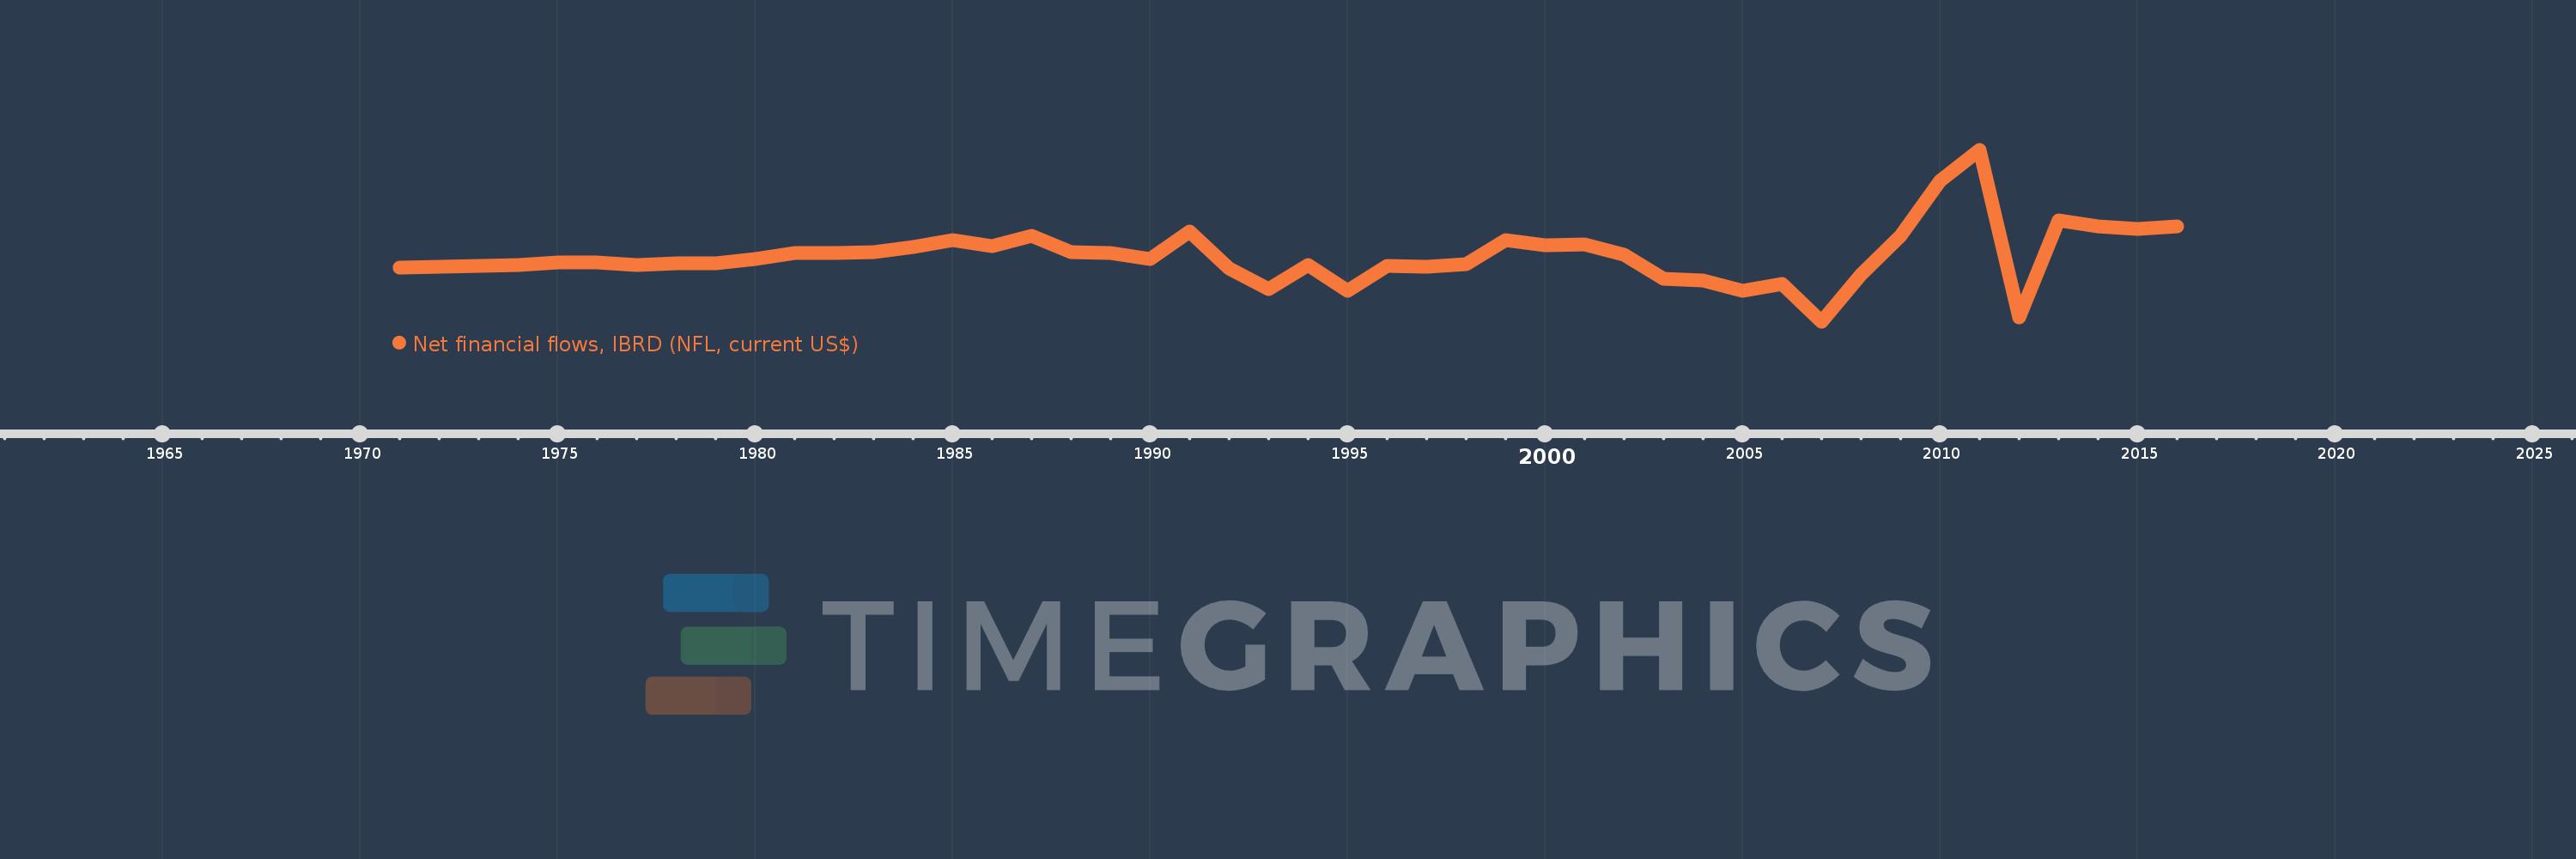
Net financial flows, IBRD (NFL, current US$)
2016,2015,2014,2013,2012,2011,2010,2009,2008,2007,2006,2005,2004,2003,2002,2001,2000,1999,1998,1997,1996,1995,1994,1993,1992,1991,1990,1989,1988,1987,1986,1985,1984,1983,1982,1981,1980,1979,1978,1977,1976,1975,1974,1973,1972,1971
This statistics in other country:
Timeline:
This timeline shows a graph from 1971 to 2016 of Latin America & Caribbean (excluding high income). No data until 1970. Number of actual observations by date: 46.
Source name:
World Development Indicators
Source organization:
World Bank, International Debt Statistics.
Categories, topics:
External Debt
Last updated:
apr 23, 2017
Indicators value changes by year
Minimum:
-3.467 bln
jan 1, 2007
Maximum:
8.161 bln
jan 1, 2011
At the date of observation
Value
Absolute change
Change from previous value
jan 1, 1971
233.836 mln
+233.836 mln
0.0%
jan 1, 1972
296.482 mln
+62.646 mln
26.79%
jan 1, 1973
351.341 mln
+54.859 mln
18.5%
jan 1, 1974
387.321 mln
+35.98 mln
10.24%
jan 1, 1975
568.716 mln
+181.395 mln
46.83%
jan 1, 1976
542.097 mln
-26.619 mln
-4.68%
jan 1, 1977
374.498 mln
-167.599 mln
-30.92%
jan 1, 1978
517.017 mln
+142.519 mln
38.06%
jan 1, 1979
515.371 mln
-1.646 mln
-0.32%
jan 1, 1980
815.093 mln
+299.722 mln
58.16%
jan 1, 1981
1.189 bln
+373.833 mln
45.86%
jan 1, 1982
1.182 bln
-6.948 mln
-0.58%
jan 1, 1983
1.264 bln
+81.658 mln
6.91%
jan 1, 1984
1.611 bln
+347.237 mln
27.48%
jan 1, 1985
2.053 bln
+442.14 mln
27.45%
jan 1, 1986
1.68 bln
-373.079 mln
-18.17%
jan 1, 1987
2.369 bln
+688.678 mln
40.99%
jan 1, 1988
1.237 bln
-1.131 bln
-47.76%
jan 1, 1989
1.178 bln
-59.269 mln
-4.79%
jan 1, 1990
796.117 mln
-382.073 mln
-32.43%
jan 1, 1991
2.677 bln
+1.881 bln
236.22%
jan 1, 1992
126.302 mln
-2.55 bln
-95.28%
jan 1, 1993
-1.227 bln
-1.353 bln
-1.07K%
jan 1, 1994
365.496 mln
+1.592 bln
-129.79%
jan 1, 1995
-1.345 bln
-1.711 bln
-468.12%
jan 1, 1996
317.165 mln
+1.663 bln
-123.57%
jan 1, 1997
291.453 mln
-25.712 mln
-8.11%
jan 1, 1998
470.042 mln
+178.589 mln
61.28%
jan 1, 1999
2.085 bln
+1.615 bln
343.53%
jan 1, 2000
1.712 bln
-372.46 mln
-17.87%
jan 1, 2001
1.786 bln
+73.938 mln
4.32%
jan 1, 2002
1.101 bln
-685.503 mln
-38.38%
jan 1, 2003
-514.825 mln
-1.616 bln
-146.77%
jan 1, 2004
-630.028 mln
-115.203 mln
22.38%
jan 1, 2005
-1.38 bln
-749.895 mln
119.03%
jan 1, 2006
-889.661 mln
+490.262 mln
-35.53%
jan 1, 2007
-3.467 bln
-2.577 bln
289.7%
jan 1, 2008
-265.888 mln
+3.201 bln
-92.33%
jan 1, 2009
2.365 bln
+2.631 bln
-989.37%
jan 1, 2010
6.11 bln
+3.746 bln
158.4%
jan 1, 2011
8.161 bln
+2.051 bln
33.56%
jan 1, 2012
-3.132 bln
-11.293 bln
-138.37%
jan 1, 2013
3.432 bln
+6.564 bln
-209.58%
jan 1, 2014
2.985 bln
-447.245 mln
-13.03%
jan 1, 2015
2.831 bln
-154.014 mln
-5.16%
jan 1, 2016
3.029 bln
+198.597 mln
7.02%
Ranking of countries by current statistics by years


Comments: