29
/
en
AIzaSyAYiBZKx7MnpbEhh9jyipgxe19OcubqV5w
April 1, 2024
46388
Low income
LIC
false
2
1
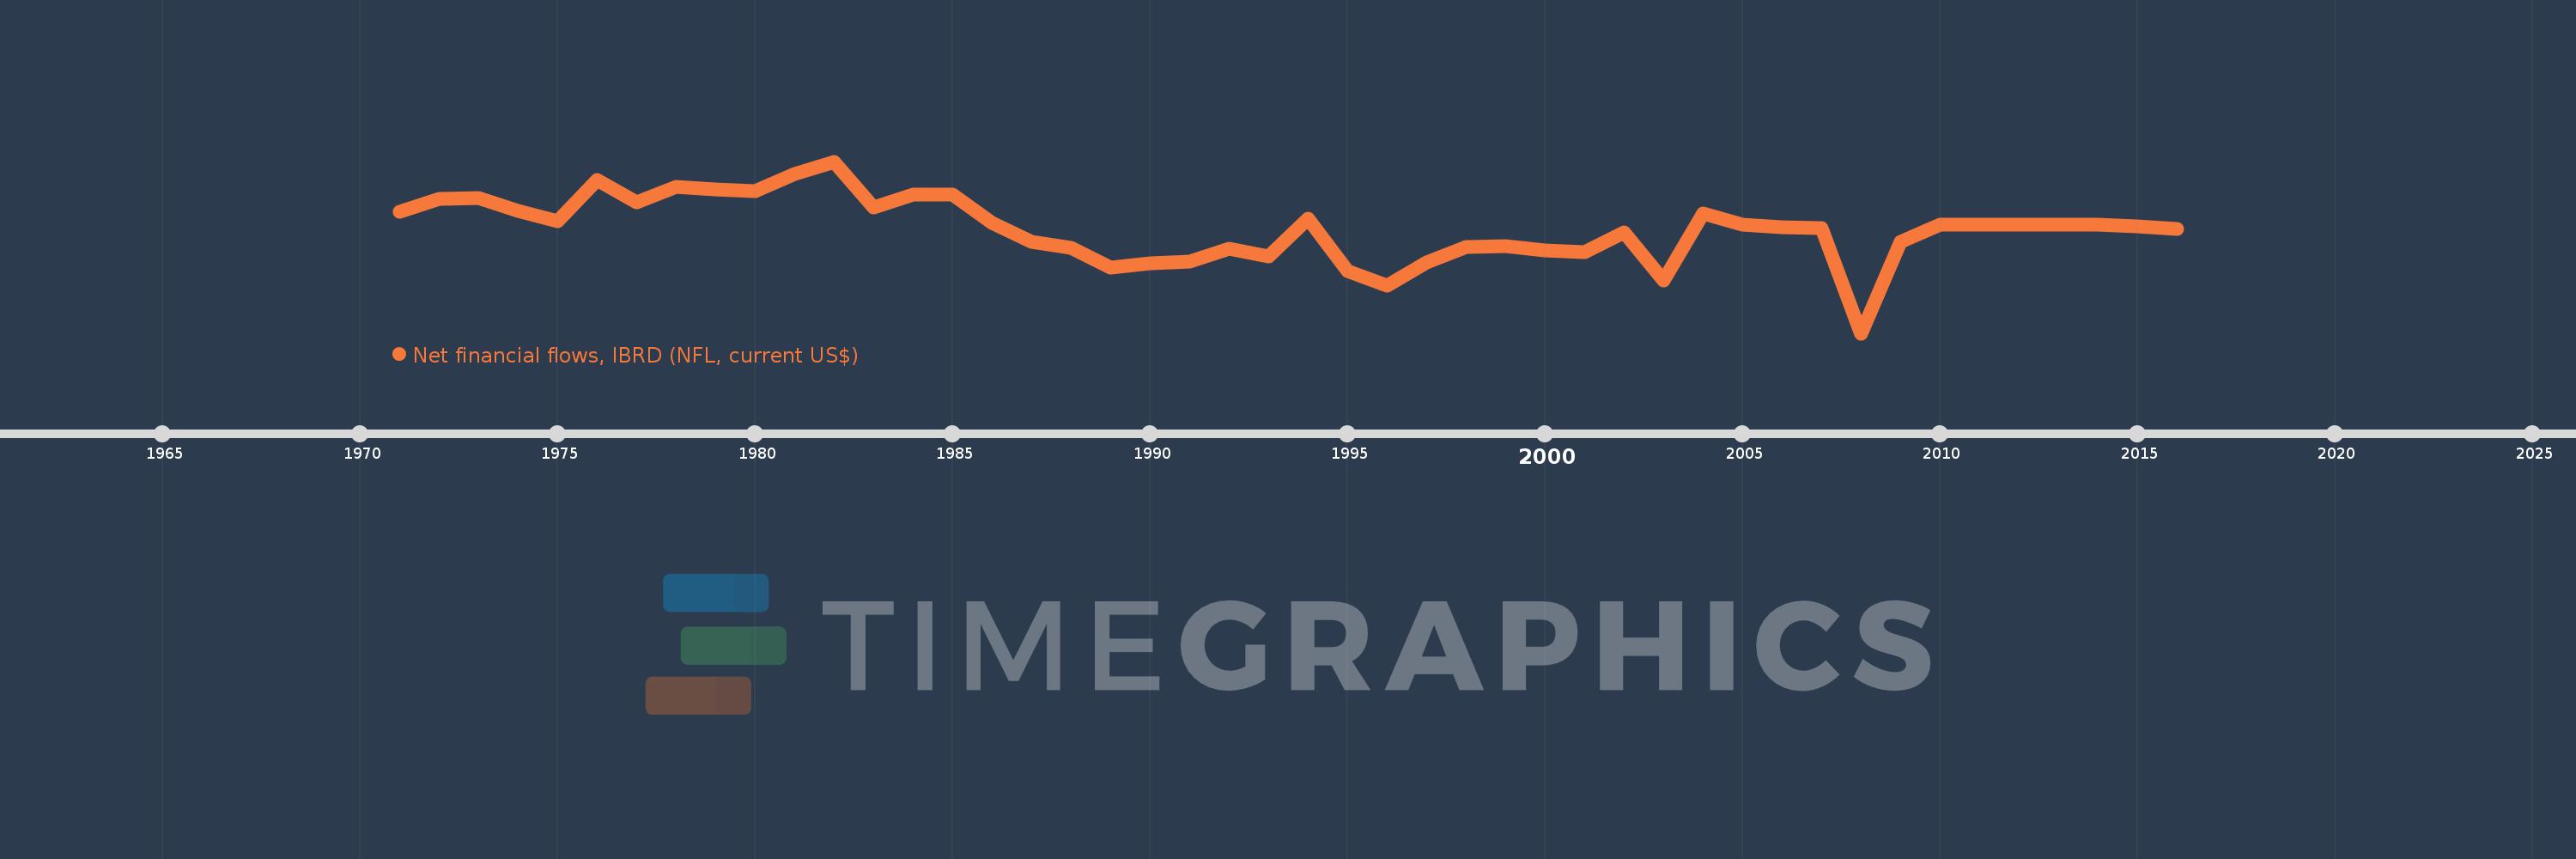
Net financial flows, IBRD (NFL, current US$)
2016,2015,2014,2012,2011,2010,2009,2008,2007,2006,2005,2004,2003,2002,2001,2000,1999,1998,1997,1996,1995,1994,1993,1992,1991,1990,1989,1988,1987,1986,1985,1984,1983,1982,1981,1980,1979,1978,1977,1976,1975,1974,1973,1972,1971
This statistics in other country:
Timeline:
This timeline shows a graph from 1971 to 2016 of Low income. No data until 1970. Number of actual observations by date: 45.
Source name:
World Development Indicators
Source organization:
World Bank, International Debt Statistics.
Categories, topics:
External Debt
Last updated:
apr 23, 2017
Indicators value changes by year
Minimum:
-167.192 mln
jan 1, 2008
Maximum:
97.624 mln
jan 1, 1982
At the date of observation
Value
Absolute change
Change from previous value
jan 1, 1971
19.817 mln
+19.817 mln
0.0%
jan 1, 1972
40.619 mln
+20.802 mln
104.97%
jan 1, 1973
41.695 mln
+1.076 mln
2.65%
jan 1, 1974
21.532 mln
-20.163 mln
-48.36%
jan 1, 1975
5.148 mln
-16.384 mln
-76.09%
jan 1, 1976
69.26 mln
+64.112 mln
1.25K%
jan 1, 1977
34.806 mln
-34.454 mln
-49.75%
jan 1, 1978
57.915 mln
+23.109 mln
66.39%
jan 1, 1979
55.16 mln
-2.755 mln
-4.76%
jan 1, 1980
52.235 mln
-2.925 mln
-5.3%
jan 1, 1981
77.934 mln
+25.699 mln
49.2%
jan 1, 1982
97.624 mln
+19.69 mln
25.26%
jan 1, 1983
26.649 mln
-70.975 mln
-72.7%
jan 1, 1984
47.305 mln
+20.656 mln
77.51%
jan 1, 1985
46.88 mln
-425.0K
-0.9%
jan 1, 1986
3.489 mln
-43.391 mln
-92.56%
jan 1, 1987
-25.789 mln
-29.278 mln
-839.15%
jan 1, 1988
-35.289 mln
-9.5 mln
36.84%
jan 1, 1989
-65.991 mln
-30.702 mln
87.0%
jan 1, 1990
-59.587 mln
+6.404 mln
-9.7%
jan 1, 1991
-56.221 mln
+3.366 mln
-5.65%
jan 1, 1992
-36.463 mln
+19.758 mln
-35.14%
jan 1, 1993
-48.277 mln
-11.814 mln
32.4%
jan 1, 1994
9.772 mln
+58.049 mln
-120.24%
jan 1, 1995
-71.431 mln
-81.203 mln
-830.98%
jan 1, 1996
-93.592 mln
-22.161 mln
31.02%
jan 1, 1997
-58.046 mln
+35.546 mln
-37.98%
jan 1, 1998
-33.955 mln
+24.091 mln
-41.5%
jan 1, 1999
-32.725 mln
+1.23 mln
-3.62%
jan 1, 2000
-39.483 mln
-6.758 mln
20.65%
jan 1, 2001
-42.588 mln
-3.105 mln
7.86%
jan 1, 2002
-11.049 mln
+31.539 mln
-74.06%
jan 1, 2003
-85.321 mln
-74.272 mln
672.21%
jan 1, 2004
17.104 mln
+102.425 mln
-120.05%
jan 1, 2005
875.0K
-16.229 mln
-94.88%
jan 1, 2006
-3.762 mln
-4.637 mln
-529.94%
jan 1, 2007
-4.702 mln
-940.0K
24.99%
jan 1, 2008
-167.192 mln
-162.49 mln
3.46K%
jan 1, 2009
-25.673 mln
+141.519 mln
-84.64%
jan 1, 2010
-9.0K
+25.664 mln
-99.96%
jan 1, 2011
-100.0K
-91.0K
1.01K%
jan 1, 2012
0.0
+100.0K
-100.0%
jan 1, 2014
-40.0K
-40.0K
%
jan 1, 2015
-2.142 mln
-2.102 mln
5.25K%
jan 1, 2016
-6.794 mln
-4.652 mln
217.18%
Ranking of countries by current statistics by years


Comments: