29
/
en
AIzaSyAYiBZKx7MnpbEhh9jyipgxe19OcubqV5w
April 1, 2024
27544
East Asia & Pacific
EAS
false
2
1
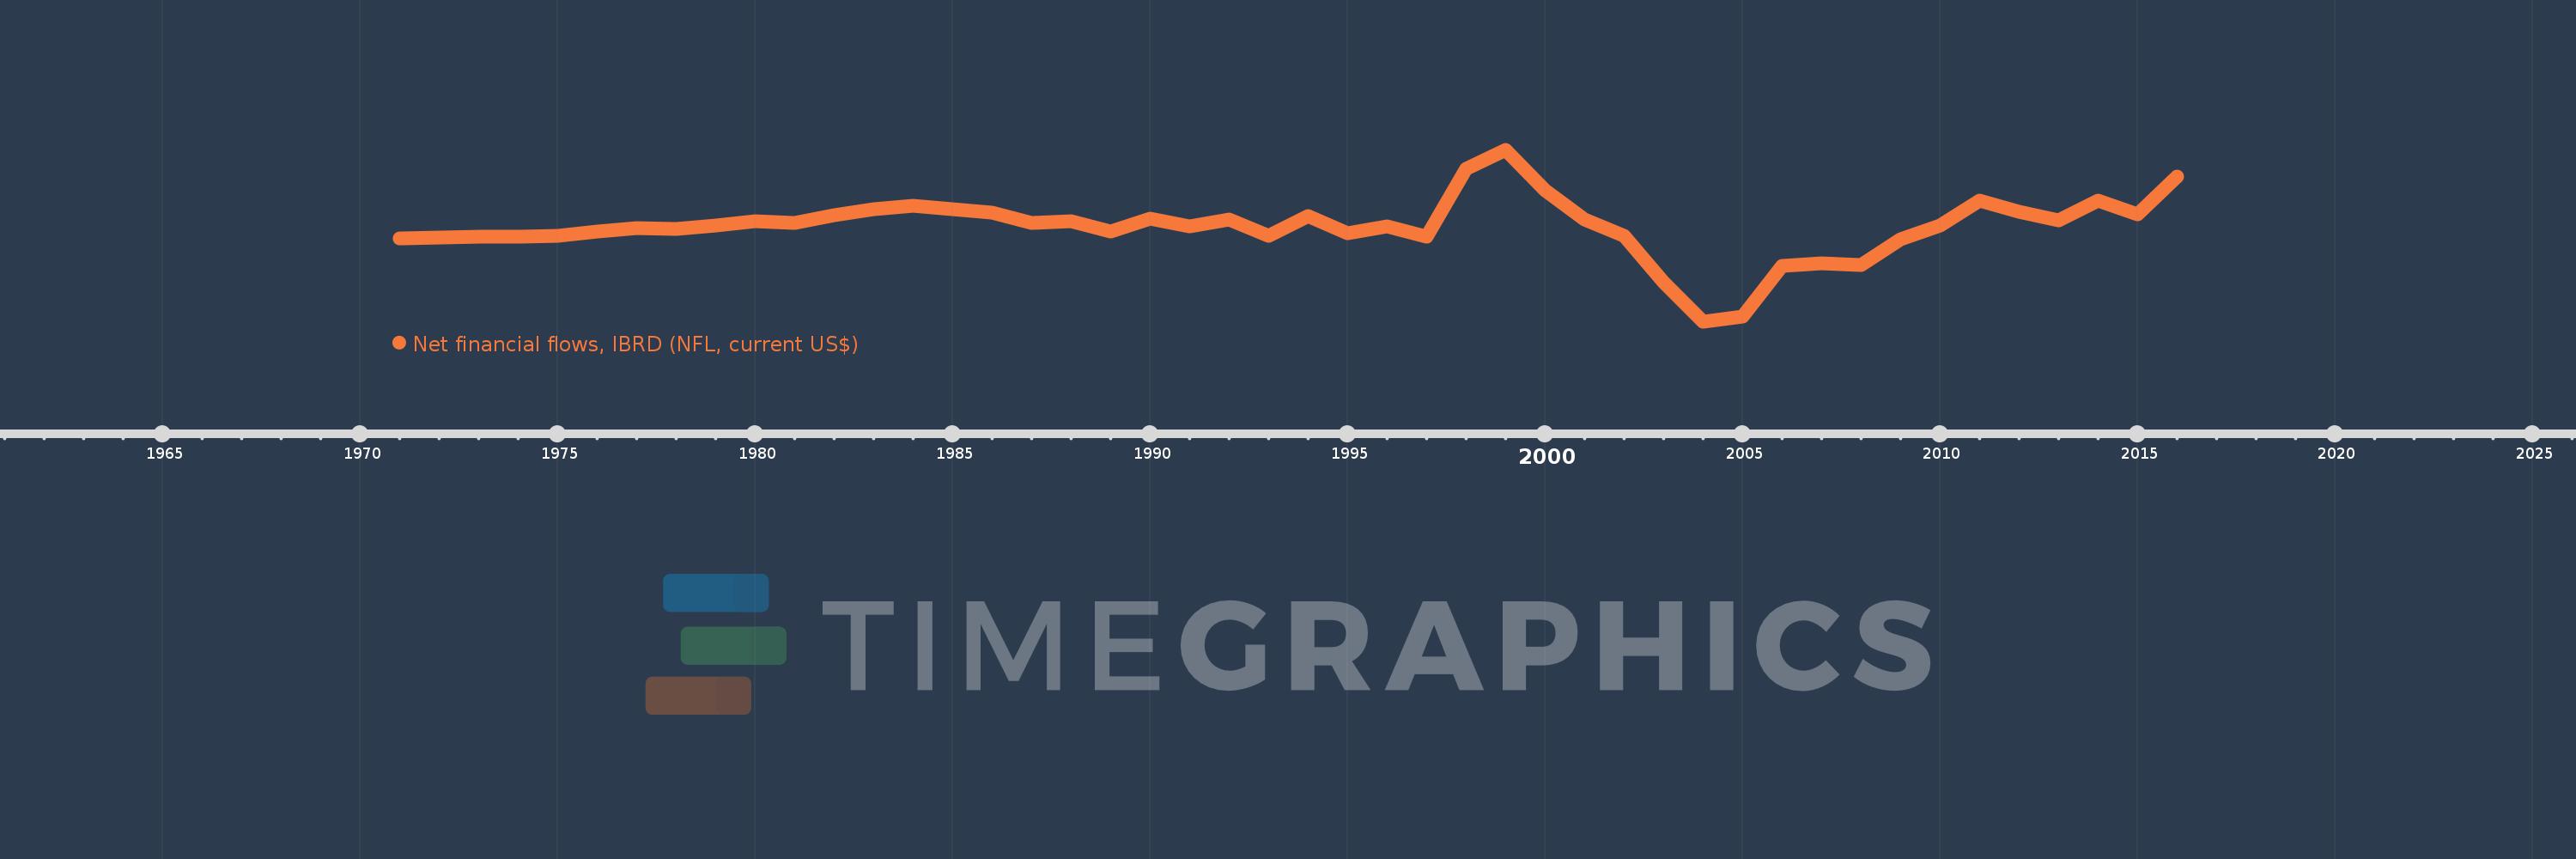
Net financial flows, IBRD (NFL, current US$)
2016,2015,2014,2013,2012,2011,2010,2009,2008,2007,2006,2005,2004,2003,2002,2001,2000,1999,1998,1997,1996,1995,1994,1993,1992,1991,1990,1989,1988,1987,1986,1985,1984,1983,1982,1981,1980,1979,1978,1977,1976,1975,1974,1973,1972,1971
This statistics in other country:
Timeline:
This timeline shows a graph from 1971 to 2016 of East Asia & Pacific. No data until 1970. Number of actual observations by date: 46.
Source name:
World Development Indicators
Source organization:
World Bank, International Debt Statistics.
Categories, topics:
External Debt
Last updated:
apr 23, 2017
Indicators value changes by year
Minimum:
-4.557 bln
jan 1, 2004
Maximum:
4.853 bln
jan 1, 1999
At the date of observation
Value
Absolute change
Change from previous value
jan 1, 1971
42.26 mln
+42.26 mln
0.0%
jan 1, 1972
66.815 mln
+24.555 mln
58.1%
jan 1, 1973
114.181 mln
+47.366 mln
70.89%
jan 1, 1974
102.421 mln
-11.76 mln
-10.3%
jan 1, 1975
170.959 mln
+68.538 mln
66.92%
jan 1, 1976
397.658 mln
+226.699 mln
132.6%
jan 1, 1977
576.263 mln
+178.605 mln
44.91%
jan 1, 1978
531.42 mln
-44.843 mln
-7.78%
jan 1, 1979
735.633 mln
+204.213 mln
38.43%
jan 1, 1980
938.549 mln
+202.916 mln
27.58%
jan 1, 1981
862.391 mln
-76.158 mln
-8.11%
jan 1, 1982
1.28 bln
+417.358 mln
48.4%
jan 1, 1983
1.601 bln
+321.684 mln
25.14%
jan 1, 1984
1.807 bln
+205.567 mln
12.84%
jan 1, 1985
1.629 bln
-177.747 mln
-9.84%
jan 1, 1986
1.439 bln
-190.454 mln
-11.69%
jan 1, 1987
854.67 mln
-584.129 mln
-40.6%
jan 1, 1988
956.827 mln
+102.157 mln
11.95%
jan 1, 1989
406.737 mln
-550.09 mln
-57.49%
jan 1, 1990
1.085 bln
+678.534 mln
166.82%
jan 1, 1991
667.913 mln
-417.358 mln
-38.46%
jan 1, 1992
1.049 bln
+381.104 mln
57.06%
jan 1, 1993
163.202 mln
-885.815 mln
-84.44%
jan 1, 1994
1.261 bln
+1.097 bln
672.38%
jan 1, 1995
306.995 mln
-953.538 mln
-75.65%
jan 1, 1996
699.453 mln
+392.457 mln
127.84%
jan 1, 1997
138.066 mln
-561.386 mln
-80.26%
jan 1, 1998
3.847 bln
+3.709 bln
2.69K%
jan 1, 1999
4.853 bln
+1.006 bln
26.14%
jan 1, 2000
2.669 bln
-2.184 bln
-45.01%
jan 1, 2001
1.052 bln
-1.617 bln
-60.59%
jan 1, 2002
168.745 mln
-883.032 mln
-83.96%
jan 1, 2003
-2.368 bln
-2.536 bln
-1.5K%
jan 1, 2004
-4.557 bln
-2.19 bln
92.48%
jan 1, 2005
-4.253 bln
+304.775 mln
-6.69%
jan 1, 2006
-1.504 bln
+2.748 bln
-64.63%
jan 1, 2007
-1.362 bln
+142.279 mln
-9.46%
jan 1, 2008
-1.459 bln
-96.929 mln
7.12%
jan 1, 2009
-33.135 mln
+1.426 bln
-97.73%
jan 1, 2010
710.641 mln
+743.776 mln
-2.24K%
jan 1, 2011
2.081 bln
+1.371 bln
192.86%
jan 1, 2012
1.492 bln
-588.86 mln
-28.29%
jan 1, 2013
1.003 bln
-489.524 mln
-32.8%
jan 1, 2014
2.095 bln
+1.092 bln
108.91%
jan 1, 2015
1.327 bln
-767.608 mln
-36.64%
jan 1, 2016
3.392 bln
+2.065 bln
155.57%
Ranking of countries by current statistics by years


Comments: