29
/
en
AIzaSyAYiBZKx7MnpbEhh9jyipgxe19OcubqV5w
April 1, 2024
236052
Senegal
SEN
true
2
1
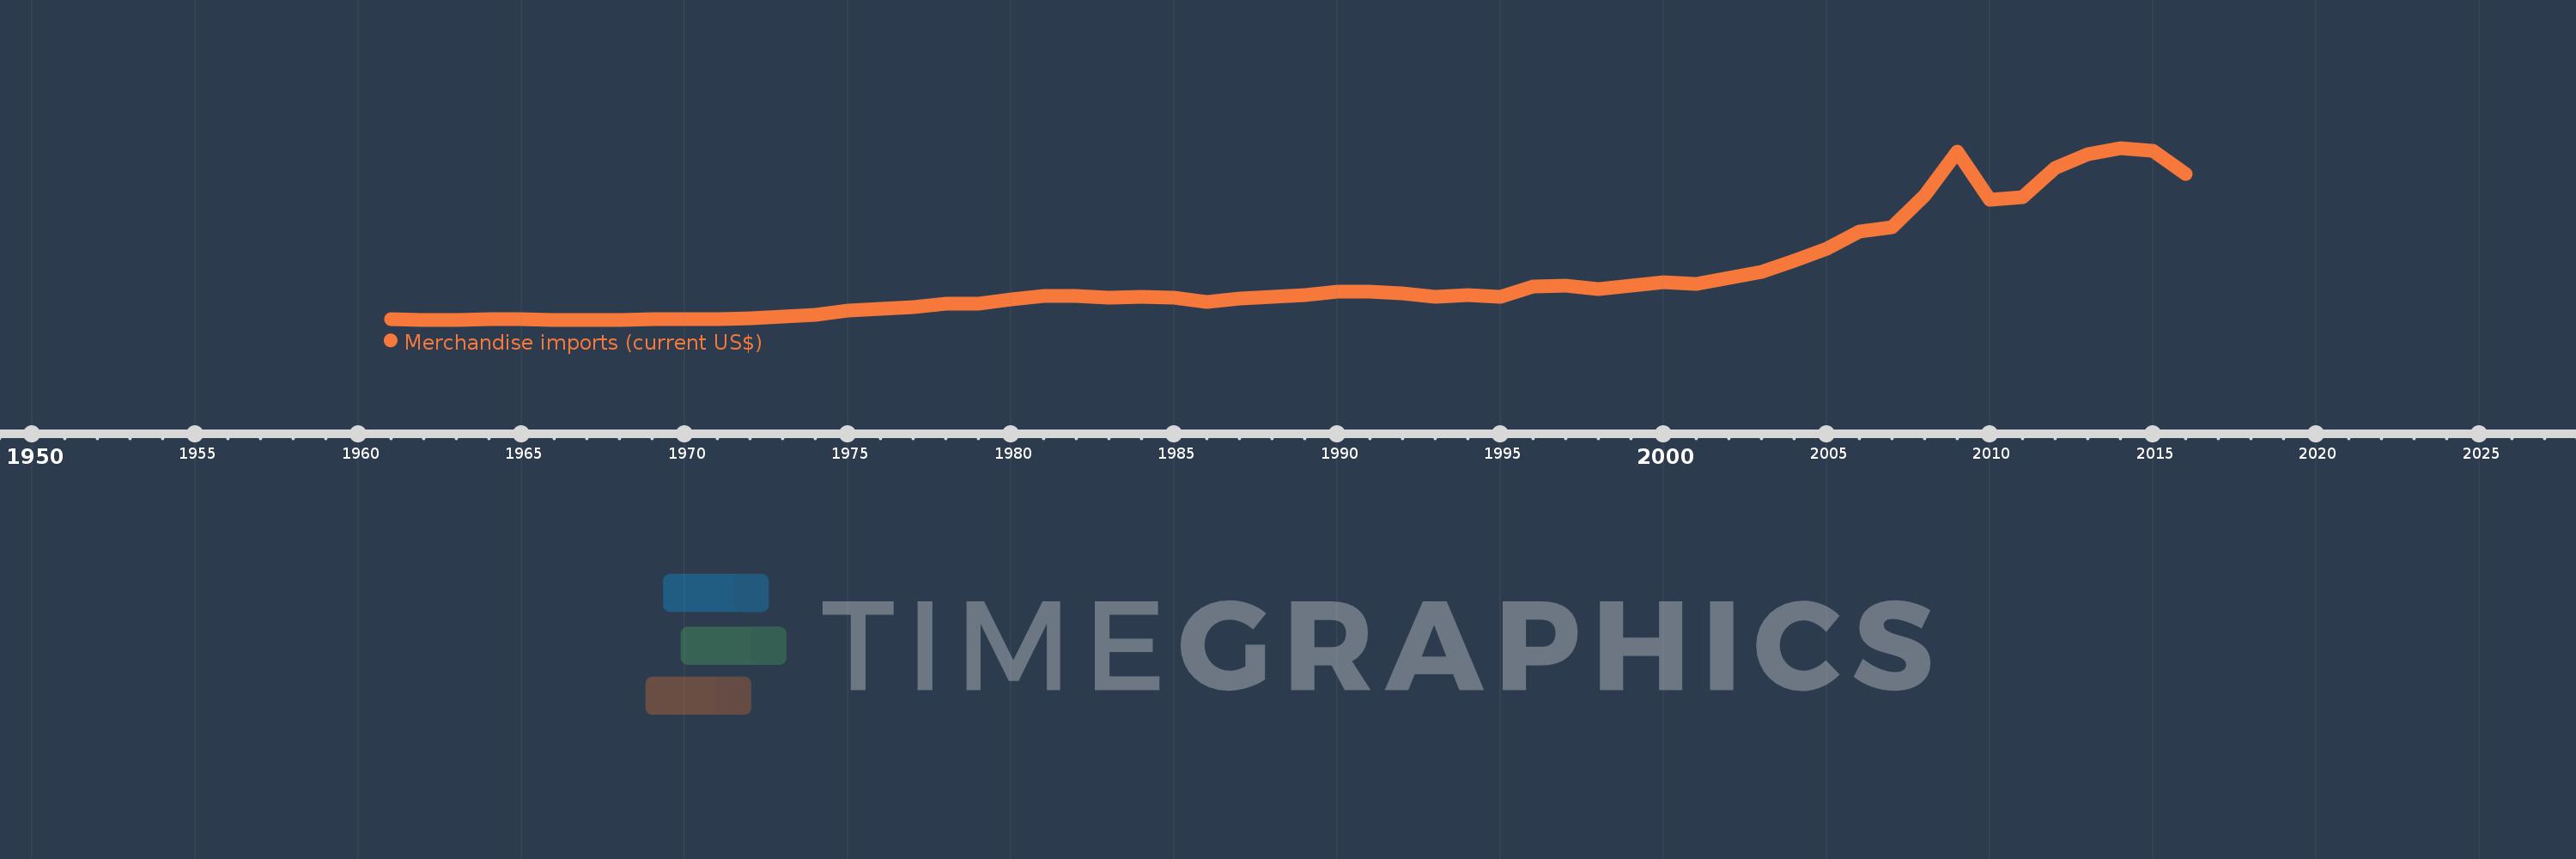
Merchandise imports (current US$)
2016,2015,2014,2013,2012,2011,2010,2009,2008,2007,2006,2005,2004,2003,2002,2001,2000,1999,1998,1997,1996,1995,1994,1993,1992,1991,1990,1989,1988,1987,1986,1985,1984,1983,1982,1981,1980,1979,1978,1977,1976,1975,1974,1973,1972,1971,1970,1969,1968,1967,1966,1965,1964,1963,1962,1961
This statistics in other country:
AfghanistanAlbaniaAlgeriaAmerican SamoaAngolaAntigua and BarbudaArab WorldArgentinaArmeniaArubaAustraliaAustriaAzerbaijanBahamas, TheBahrainBangladeshBarbadosBelarusBelgiumBelizeBeninBermudaBhutanBoliviaBosnia and HerzegovinaBotswanaBrazilBrunei DarussalamBulgariaBurkina FasoBurundiCabo VerdeCambodiaCameroonCanadaCaribbean small statesCentral African RepublicCentral Europe and the BalticsChadChileChinaColombiaComorosCongo, Dem. Rep.Congo, Rep.Costa RicaCote d'IvoireCroatiaCubaCuracaoCyprusCzech RepublicDenmarkDjiboutiDominicaDominican RepublicEarly-demographic dividendEast Asia & PacificEast Asia & Pacific (excluding high income)East Asia & Pacific (IDA & IBRD countries)EcuadorEgypt, Arab Rep.El SalvadorEquatorial GuineaEritreaEstoniaEthiopiaEuro areaEurope & Central AsiaEurope & Central Asia (excluding high income)Europe & Central Asia (IDA & IBRD countries)European UnionFaroe IslandsFijiFinlandFragile and conflict affected situationsFranceFrench PolynesiaGabonGambia, TheGeorgiaGermanyGhanaGreeceGreenlandGrenadaGuatemalaGuineaGuinea-BissauGuyanaHaitiHeavily indebted poor countries (HIPC)High incomeHondurasHong Kong SAR, ChinaHungaryIBRD onlyIcelandIDA & IBRD totalIDA blendIDA onlyIDA totalIndiaIndonesiaIran, Islamic Rep.IraqIrelandIsraelItalyJamaicaJapanJordanKazakhstanKenyaKiribatiKorea, Dem. People’s Rep.Korea, Rep.KuwaitKyrgyz RepublicLao PDRLate-demographic dividendLatin America & Caribbean Latin America & Caribbean (excluding high income)Latin America & the Caribbean (IDA & IBRD countries)LatviaLeast developed countries: UN classificationLebanonLesothoLiberiaLibyaLithuaniaLow & middle incomeLow incomeLower middle incomeLuxembourgMacao SAR, ChinaMacedonia, FYRMadagascarMalawiMalaysiaMaldivesMaliMaltaMarshall IslandsMauritaniaMauritiusMexicoMicronesia, Fed. Sts.Middle East & North AfricaMiddle East & North Africa (excluding high income)Middle East & North Africa (IDA & IBRD countries)Middle incomeMoldovaMongoliaMontenegroMoroccoMozambiqueMyanmarNamibiaNepalNetherlandsNew CaledoniaNew ZealandNicaraguaNigerNigeriaNorth AmericaNorthern Mariana IslandsNorwayOECD membersOmanOther small statesPacific island small statesPakistanPalauPanamaPapua New GuineaParaguayPeruPhilippinesPolandPortugalPost-demographic dividendPre-demographic dividendQatarRomaniaRussian FederationRwandaSamoaSao Tome and PrincipeSaudi ArabiaSenegalSerbiaSeychellesSierra LeoneSingaporeSint Maarten (Dutch part)Slovak RepublicSloveniaSmall statesSolomon IslandsSouth AfricaSouth AsiaSouth Asia (IDA & IBRD)SpainSri LankaSt. Kitts and NevisSt. LuciaSt. Martin (French part)St. Vincent and the GrenadinesSub-Saharan Africa Sub-Saharan Africa (excluding high income)Sub-Saharan Africa (IDA & IBRD countries)SudanSurinameSwazilandSwedenSwitzerlandSyrian Arab RepublicTajikistanTanzaniaThailandTimor-LesteTogoTongaTrinidad and TobagoTunisiaTurkeyTurkmenistanTuvaluUgandaUkraineUnited Arab EmiratesUnited KingdomUnited StatesUpper middle incomeUruguayUzbekistanVanuatuVenezuela, RBVietnamWorldYemen, Rep.ZambiaZimbabwe Timeline:
This timeline shows a graph from 1961 to 2016 of Senegal. No data until 1960. Number of actual observations by date: 56.
Source name:
World Development Indicators
Source organization:
World Trade Organization.
Categories, topics:
Private Sector, Trade
Last updated:
apr 23, 2017
Indicators value changes by year
Minimum:
159.933 mln
jan 1, 1967
Maximum:
6.659 bln
jan 1, 2014
At the date of observation
Value
Absolute change
Change from previous value
jan 1, 1961
172.086 mln
+172.086 mln
0.0%
jan 1, 1962
163.215 mln
-8.871 mln
-5.15%
jan 1, 1963
162.404 mln
-811.0K
-0.5%
jan 1, 1964
171.195 mln
+8.791 mln
5.41%
jan 1, 1965
176.664 mln
+5.469 mln
3.19%
jan 1, 1966
162.85 mln
-13.814 mln
-7.82%
jan 1, 1967
159.933 mln
-2.917 mln
-1.79%
jan 1, 1968
165.402 mln
+5.469 mln
3.42%
jan 1, 1969
185.536 mln
+20.134 mln
12.17%
jan 1, 1970
194.296 mln
+8.76 mln
4.72%
jan 1, 1971
193.944 mln
-352.0K
-0.18%
jan 1, 1972
218.973 mln
+25.029 mln
12.91%
jan 1, 1973
279.914 mln
+60.941 mln
27.83%
jan 1, 1974
360.672 mln
+80.758 mln
28.85%
jan 1, 1975
497.552 mln
+136.88 mln
37.95%
jan 1, 1976
583.325 mln
+85.773 mln
17.24%
jan 1, 1977
635.524 mln
+52.199 mln
8.95%
jan 1, 1978
764.071 mln
+128.547 mln
20.23%
jan 1, 1979
754.733 mln
-9.338 mln
-1.22%
jan 1, 1980
930.7 mln
+175.967 mln
23.32%
jan 1, 1981
1.052 bln
+121.3 mln
13.03%
jan 1, 1982
1.076 bln
+24.0 mln
2.28%
jan 1, 1983
992.0 mln
-84.0 mln
-7.81%
jan 1, 1984
1.025 bln
+33.0 mln
3.33%
jan 1, 1985
981.0 mln
-44.0 mln
-4.29%
jan 1, 1986
826.0 mln
-155.0 mln
-15.8%
jan 1, 1987
961.0 mln
+135.0 mln
16.34%
jan 1, 1988
1.024 bln
+63.0 mln
6.56%
jan 1, 1989
1.08 bln
+56.0 mln
5.47%
jan 1, 1990
1.221 bln
+141.0 mln
13.06%
jan 1, 1991
1.219 bln
-2.0 mln
-0.16%
jan 1, 1992
1.173 bln
-46.0 mln
-3.77%
jan 1, 1993
1.034 bln
-139.0 mln
-11.85%
jan 1, 1994
1.087 bln
+53.0 mln
5.13%
jan 1, 1995
1.022 bln
-65.0 mln
-5.98%
jan 1, 1996
1.412 bln
+390.0 mln
38.16%
jan 1, 1997
1.436 bln
+24.0 mln
1.7%
jan 1, 1998
1.335 bln
-101.0 mln
-7.03%
jan 1, 1999
1.455 bln
+120.0 mln
8.99%
jan 1, 2000
1.564 bln
+109.0 mln
7.49%
jan 1, 2001
1.519 bln
-45.0 mln
-2.88%
jan 1, 2002
1.73 bln
+211.0 mln
13.89%
jan 1, 2003
1.958 bln
+228.0 mln
13.18%
jan 1, 2004
2.391 bln
+432.91 mln
22.11%
jan 1, 2005
2.839 bln
+448.223 mln
18.75%
jan 1, 2006
3.498 bln
+658.568 mln
23.2%
jan 1, 2007
3.671 bln
+173.292 mln
4.95%
jan 1, 2008
4.871 bln
+1.2 bln
32.7%
jan 1, 2009
6.528 bln
+1.656 bln
34.0%
jan 1, 2010
4.713 bln
-1.815 bln
-27.8%
jan 1, 2011
4.782 bln
+69.341 mln
1.47%
jan 1, 2012
5.909 bln
+1.127 bln
23.56%
jan 1, 2013
6.434 bln
+525.299 mln
8.89%
jan 1, 2014
6.659 bln
+225.144 mln
3.5%
jan 1, 2015
6.557 bln
-102.703 mln
-1.54%
jan 1, 2016
5.675 bln
-881.449 mln
-13.44%
Ranking of countries by current statistics by years


Comments: