29
/
en
AIzaSyAYiBZKx7MnpbEhh9jyipgxe19OcubqV5w
April 1, 2024
119162
Denmark
DNK
true
2
1
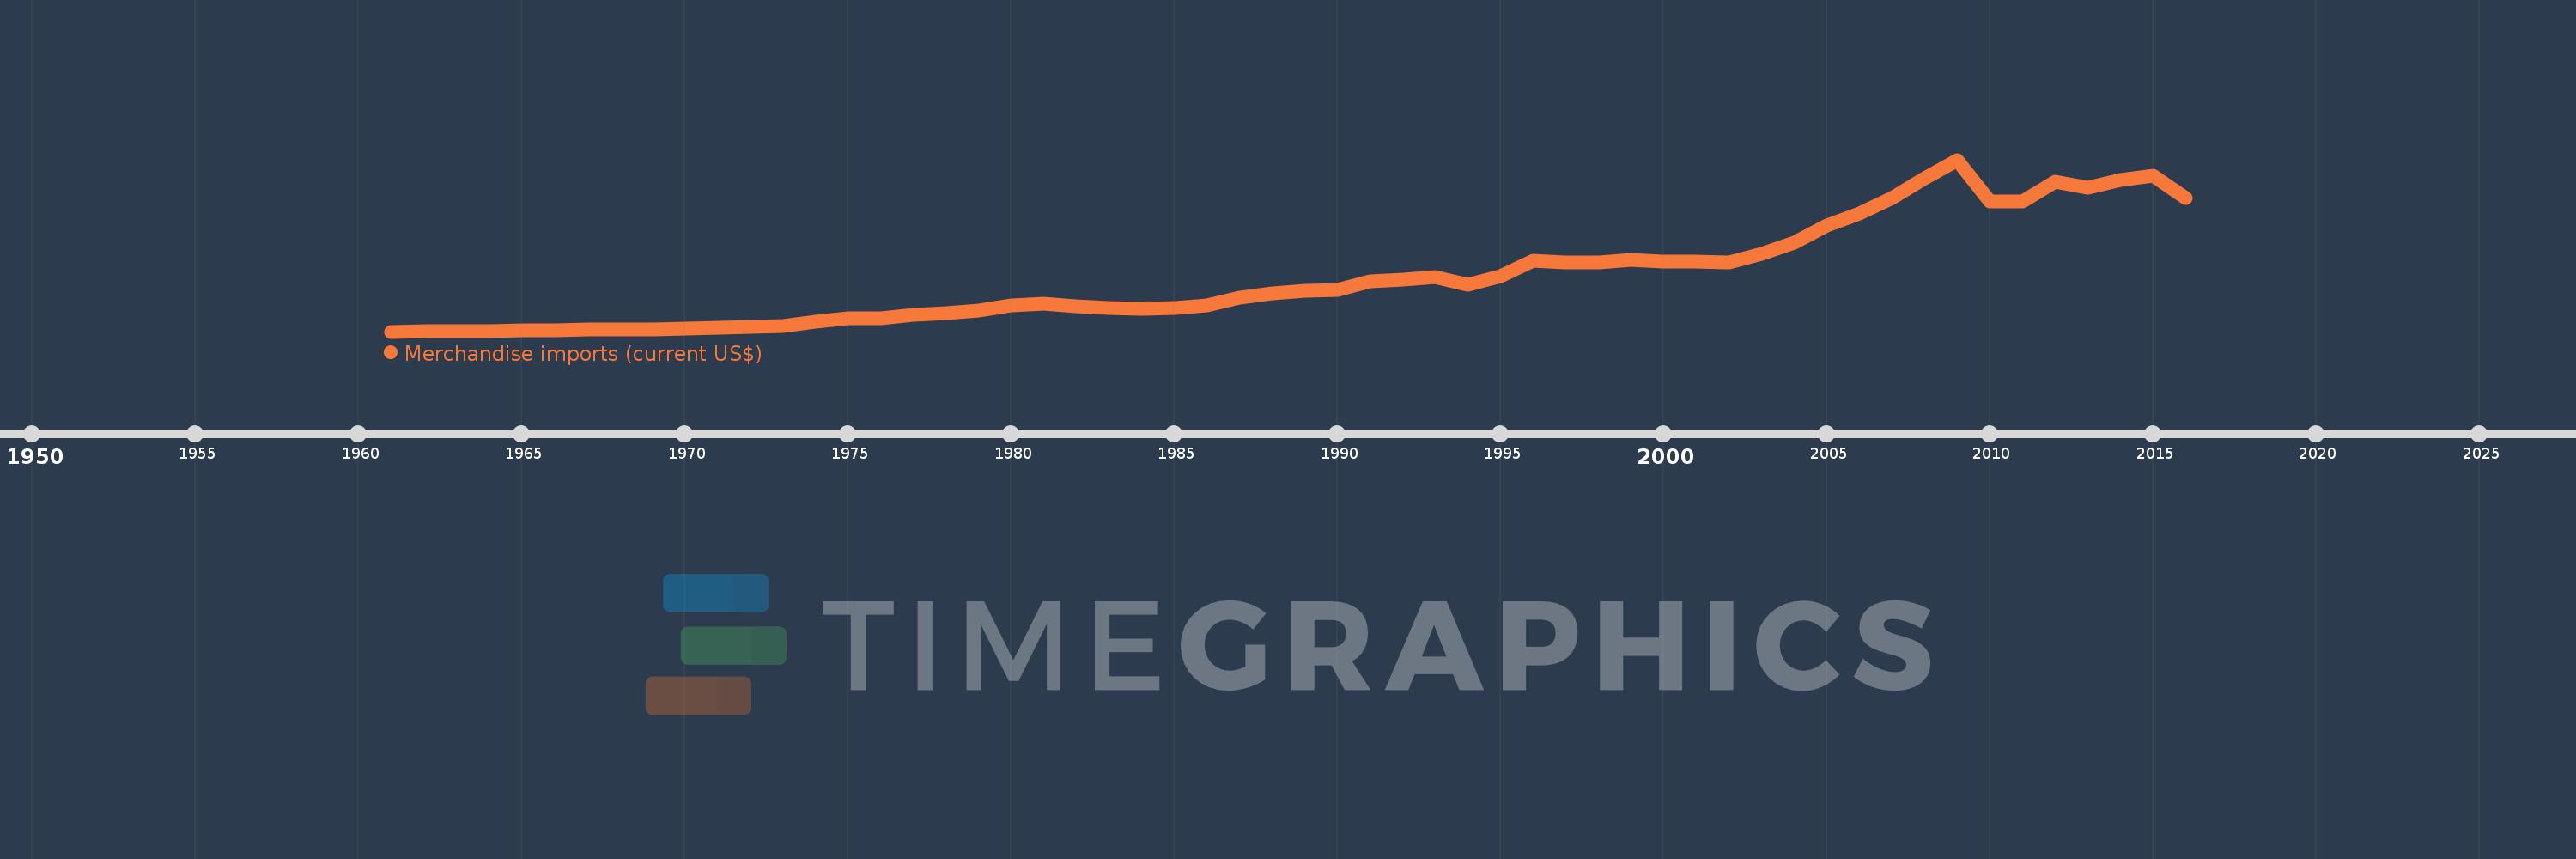
Merchandise imports (current US$)
2016,2015,2014,2013,2012,2011,2010,2009,2008,2007,2006,2005,2004,2003,2002,2001,2000,1999,1998,1997,1996,1995,1994,1993,1992,1991,1990,1989,1988,1987,1986,1985,1984,1983,1982,1981,1980,1979,1978,1977,1976,1975,1974,1973,1972,1971,1970,1969,1968,1967,1966,1965,1964,1963,1962,1961
This statistics in other country:
AfghanistanAlbaniaAlgeriaAmerican SamoaAngolaAntigua and BarbudaArab WorldArgentinaArmeniaArubaAustraliaAustriaAzerbaijanBahamas, TheBahrainBangladeshBarbadosBelarusBelgiumBelizeBeninBermudaBhutanBoliviaBosnia and HerzegovinaBotswanaBrazilBrunei DarussalamBulgariaBurkina FasoBurundiCabo VerdeCambodiaCameroonCanadaCaribbean small statesCentral African RepublicCentral Europe and the BalticsChadChileChinaColombiaComorosCongo, Dem. Rep.Congo, Rep.Costa RicaCote d'IvoireCroatiaCubaCuracaoCyprusCzech RepublicDenmarkDjiboutiDominicaDominican RepublicEarly-demographic dividendEast Asia & PacificEast Asia & Pacific (excluding high income)East Asia & Pacific (IDA & IBRD countries)EcuadorEgypt, Arab Rep.El SalvadorEquatorial GuineaEritreaEstoniaEthiopiaEuro areaEurope & Central AsiaEurope & Central Asia (excluding high income)Europe & Central Asia (IDA & IBRD countries)European UnionFaroe IslandsFijiFinlandFragile and conflict affected situationsFranceFrench PolynesiaGabonGambia, TheGeorgiaGermanyGhanaGreeceGreenlandGrenadaGuatemalaGuineaGuinea-BissauGuyanaHaitiHeavily indebted poor countries (HIPC)High incomeHondurasHong Kong SAR, ChinaHungaryIBRD onlyIcelandIDA & IBRD totalIDA blendIDA onlyIDA totalIndiaIndonesiaIran, Islamic Rep.IraqIrelandIsraelItalyJamaicaJapanJordanKazakhstanKenyaKiribatiKorea, Dem. People’s Rep.Korea, Rep.KuwaitKyrgyz RepublicLao PDRLate-demographic dividendLatin America & Caribbean Latin America & Caribbean (excluding high income)Latin America & the Caribbean (IDA & IBRD countries)LatviaLeast developed countries: UN classificationLebanonLesothoLiberiaLibyaLithuaniaLow & middle incomeLow incomeLower middle incomeLuxembourgMacao SAR, ChinaMacedonia, FYRMadagascarMalawiMalaysiaMaldivesMaliMaltaMarshall IslandsMauritaniaMauritiusMexicoMicronesia, Fed. Sts.Middle East & North AfricaMiddle East & North Africa (excluding high income)Middle East & North Africa (IDA & IBRD countries)Middle incomeMoldovaMongoliaMontenegroMoroccoMozambiqueMyanmarNamibiaNepalNetherlandsNew CaledoniaNew ZealandNicaraguaNigerNigeriaNorth AmericaNorthern Mariana IslandsNorwayOECD membersOmanOther small statesPacific island small statesPakistanPalauPanamaPapua New GuineaParaguayPeruPhilippinesPolandPortugalPost-demographic dividendPre-demographic dividendQatarRomaniaRussian FederationRwandaSamoaSao Tome and PrincipeSaudi ArabiaSenegalSerbiaSeychellesSierra LeoneSingaporeSint Maarten (Dutch part)Slovak RepublicSloveniaSmall statesSolomon IslandsSouth AfricaSouth AsiaSouth Asia (IDA & IBRD)SpainSri LankaSt. Kitts and NevisSt. LuciaSt. Martin (French part)St. Vincent and the GrenadinesSub-Saharan Africa Sub-Saharan Africa (excluding high income)Sub-Saharan Africa (IDA & IBRD countries)SudanSurinameSwazilandSwedenSwitzerlandSyrian Arab RepublicTajikistanTanzaniaThailandTimor-LesteTogoTongaTrinidad and TobagoTunisiaTurkeyTurkmenistanTuvaluUgandaUkraineUnited Arab EmiratesUnited KingdomUnited StatesUpper middle incomeUruguayUzbekistanVanuatuVenezuela, RBVietnamWorldYemen, Rep.ZambiaZimbabwe Timeline:
This timeline shows a graph from 1961 to 2016 of Denmark. No data until 1960. Number of actual observations by date: 56.
Source name:
World Development Indicators
Source organization:
World Trade Organization.
Categories, topics:
Private Sector, Trade
Last updated:
apr 23, 2017
Indicators value changes by year
Minimum:
1.807 bln
jan 1, 1961
Maximum:
109.362 bln
jan 1, 2009
At the date of observation
Value
Absolute change
Change from previous value
jan 1, 1961
1.807 bln
+1.807 bln
0.0%
jan 1, 1962
1.873 bln
+66.31 mln
3.67%
jan 1, 1963
2.13 bln
+256.69 mln
13.7%
jan 1, 1964
2.129 bln
-1.45 mln
-0.07%
jan 1, 1965
2.617 bln
+488.48 mln
22.95%
jan 1, 1966
2.823 bln
+205.73 mln
7.86%
jan 1, 1967
3.003 bln
+179.96 mln
6.38%
jan 1, 1968
3.153 bln
+150.7 mln
5.02%
jan 1, 1969
3.236 bln
+82.88 mln
2.63%
jan 1, 1970
3.813 bln
+576.8 mln
17.82%
jan 1, 1971
4.407 bln
+594.13 mln
15.58%
jan 1, 1972
4.608 bln
+200.45 mln
4.55%
jan 1, 1973
5.087 bln
+479.79 mln
10.41%
jan 1, 1974
7.802 bln
+2.714 bln
53.35%
jan 1, 1975
9.927 bln
+2.125 bln
27.23%
jan 1, 1976
10.368 bln
+441.77 mln
4.45%
jan 1, 1977
12.427 bln
+2.058 bln
19.85%
jan 1, 1978
13.265 bln
+838.5 mln
6.75%
jan 1, 1979
14.808 bln
+1.543 bln
11.63%
jan 1, 1980
18.401 bln
+3.593 bln
24.26%
jan 1, 1981
19.34 bln
+938.6 mln
5.1%
jan 1, 1982
17.58 bln
-1.76 bln
-9.1%
jan 1, 1983
16.692 bln
-888.0 mln
-5.05%
jan 1, 1984
16.266 bln
-426.0 mln
-2.55%
jan 1, 1985
16.613 bln
+347.0 mln
2.13%
jan 1, 1986
18.245 bln
+1.632 bln
9.82%
jan 1, 1987
22.878 bln
+4.633 bln
25.39%
jan 1, 1988
25.499 bln
+2.621 bln
11.46%
jan 1, 1989
27.228 bln
+1.729 bln
6.78%
jan 1, 1990
28.015 bln
+787.0 mln
2.89%
jan 1, 1991
33.333 bln
+5.318 bln
18.98%
jan 1, 1992
34.19 bln
+857.0 mln
2.57%
jan 1, 1993
35.714 bln
+1.524 bln
4.46%
jan 1, 1994
31.309 bln
-4.405 bln
-12.33%
jan 1, 1995
36.691 bln
+5.382 bln
17.19%
jan 1, 1996
45.939 bln
+9.248 bln
25.21%
jan 1, 1997
45.291 bln
-648.0 mln
-1.41%
jan 1, 1998
44.902 bln
-389.0 mln
-0.86%
jan 1, 1999
46.873 bln
+1.971 bln
4.39%
jan 1, 2000
45.753 bln
-1.119 bln
-2.39%
jan 1, 2001
45.557 bln
-196.253 mln
-0.43%
jan 1, 2002
45.322 bln
-235.362 mln
-0.52%
jan 1, 2003
50.32 bln
+4.998 bln
11.03%
jan 1, 2004
57.429 bln
+7.108 bln
14.13%
jan 1, 2005
68.157 bln
+10.728 bln
18.68%
jan 1, 2006
75.581 bln
+7.424 bln
10.89%
jan 1, 2007
85.507 bln
+9.926 bln
13.13%
jan 1, 2008
98.027 bln
+12.52 bln
14.64%
jan 1, 2009
109.362 bln
+11.335 bln
11.56%
jan 1, 2010
83.133 bln
-26.229 bln
-23.98%
jan 1, 2011
83.052 bln
-80.823 mln
-0.1%
jan 1, 2012
95.663 bln
+12.611 bln
15.18%
jan 1, 2013
91.925 bln
-3.738 bln
-3.91%
jan 1, 2014
96.589 bln
+4.665 bln
5.07%
jan 1, 2015
99.349 bln
+2.759 bln
2.86%
jan 1, 2016
85.522 bln
-13.826 bln
-13.92%
Ranking of countries by current statistics by years


Comments: