29
/
en
AIzaSyAYiBZKx7MnpbEhh9jyipgxe19OcubqV5w
April 1, 2024
201863
Morocco
MAR
true
2
1
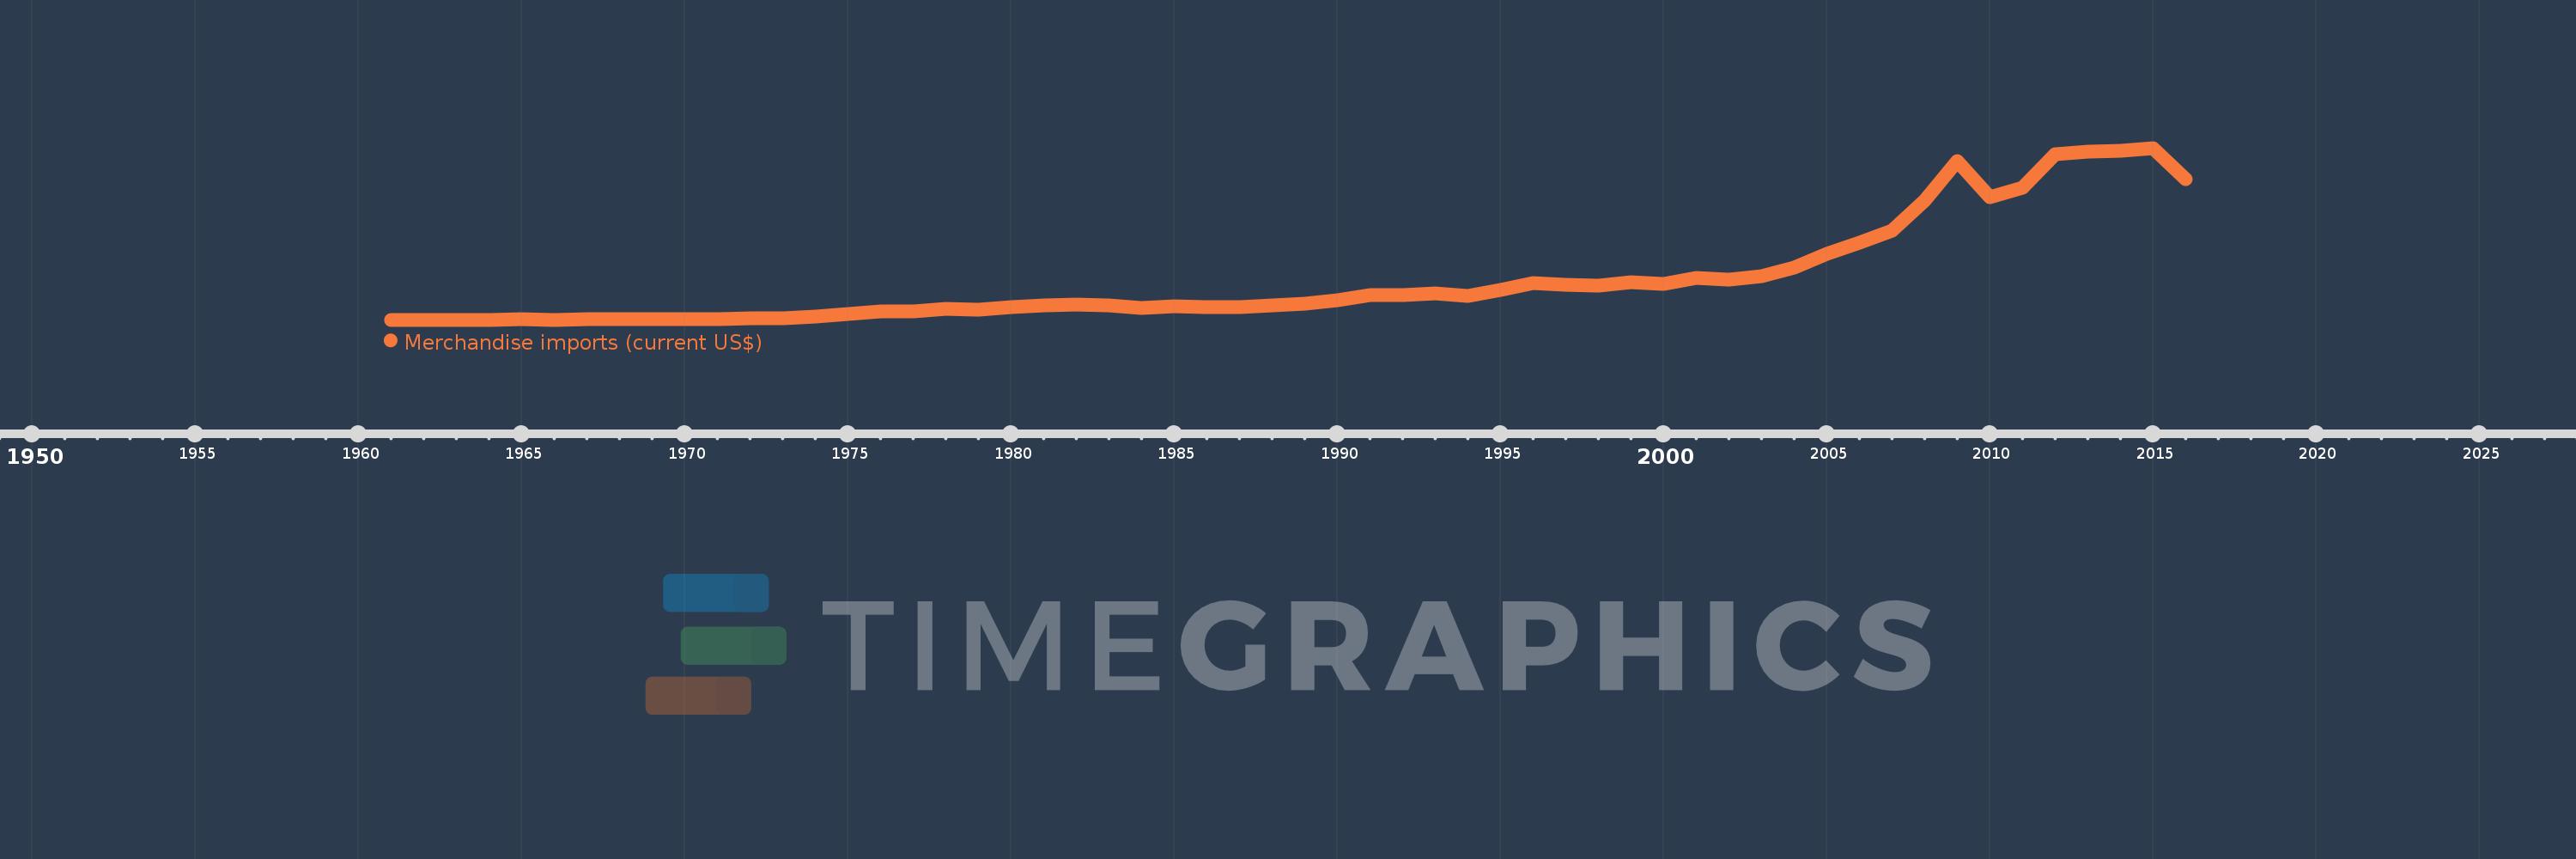
Merchandise imports (current US$)
2016,2015,2014,2013,2012,2011,2010,2009,2008,2007,2006,2005,2004,2003,2002,2001,2000,1999,1998,1997,1996,1995,1994,1993,1992,1991,1990,1989,1988,1987,1986,1985,1984,1983,1982,1981,1980,1979,1978,1977,1976,1975,1974,1973,1972,1971,1970,1969,1968,1967,1966,1965,1964,1963,1962,1961
This statistics in other country:
AfghanistanAlbaniaAlgeriaAmerican SamoaAngolaAntigua and BarbudaArab WorldArgentinaArmeniaArubaAustraliaAustriaAzerbaijanBahamas, TheBahrainBangladeshBarbadosBelarusBelgiumBelizeBeninBermudaBhutanBoliviaBosnia and HerzegovinaBotswanaBrazilBrunei DarussalamBulgariaBurkina FasoBurundiCabo VerdeCambodiaCameroonCanadaCaribbean small statesCentral African RepublicCentral Europe and the BalticsChadChileChinaColombiaComorosCongo, Dem. Rep.Congo, Rep.Costa RicaCote d'IvoireCroatiaCubaCuracaoCyprusCzech RepublicDenmarkDjiboutiDominicaDominican RepublicEarly-demographic dividendEast Asia & PacificEast Asia & Pacific (excluding high income)East Asia & Pacific (IDA & IBRD countries)EcuadorEgypt, Arab Rep.El SalvadorEquatorial GuineaEritreaEstoniaEthiopiaEuro areaEurope & Central AsiaEurope & Central Asia (excluding high income)Europe & Central Asia (IDA & IBRD countries)European UnionFaroe IslandsFijiFinlandFragile and conflict affected situationsFranceFrench PolynesiaGabonGambia, TheGeorgiaGermanyGhanaGreeceGreenlandGrenadaGuatemalaGuineaGuinea-BissauGuyanaHaitiHeavily indebted poor countries (HIPC)High incomeHondurasHong Kong SAR, ChinaHungaryIBRD onlyIcelandIDA & IBRD totalIDA blendIDA onlyIDA totalIndiaIndonesiaIran, Islamic Rep.IraqIrelandIsraelItalyJamaicaJapanJordanKazakhstanKenyaKiribatiKorea, Dem. People’s Rep.Korea, Rep.KuwaitKyrgyz RepublicLao PDRLate-demographic dividendLatin America & Caribbean Latin America & Caribbean (excluding high income)Latin America & the Caribbean (IDA & IBRD countries)LatviaLeast developed countries: UN classificationLebanonLesothoLiberiaLibyaLithuaniaLow & middle incomeLow incomeLower middle incomeLuxembourgMacao SAR, ChinaMacedonia, FYRMadagascarMalawiMalaysiaMaldivesMaliMaltaMarshall IslandsMauritaniaMauritiusMexicoMicronesia, Fed. Sts.Middle East & North AfricaMiddle East & North Africa (excluding high income)Middle East & North Africa (IDA & IBRD countries)Middle incomeMoldovaMongoliaMontenegroMoroccoMozambiqueMyanmarNamibiaNepalNetherlandsNew CaledoniaNew ZealandNicaraguaNigerNigeriaNorth AmericaNorthern Mariana IslandsNorwayOECD membersOmanOther small statesPacific island small statesPakistanPalauPanamaPapua New GuineaParaguayPeruPhilippinesPolandPortugalPost-demographic dividendPre-demographic dividendQatarRomaniaRussian FederationRwandaSamoaSao Tome and PrincipeSaudi ArabiaSenegalSerbiaSeychellesSierra LeoneSingaporeSint Maarten (Dutch part)Slovak RepublicSloveniaSmall statesSolomon IslandsSouth AfricaSouth AsiaSouth Asia (IDA & IBRD)SpainSri LankaSt. Kitts and NevisSt. LuciaSt. Martin (French part)St. Vincent and the GrenadinesSub-Saharan Africa Sub-Saharan Africa (excluding high income)Sub-Saharan Africa (IDA & IBRD countries)SudanSurinameSwazilandSwedenSwitzerlandSyrian Arab RepublicTajikistanTanzaniaThailandTimor-LesteTogoTongaTrinidad and TobagoTunisiaTurkeyTurkmenistanTuvaluUgandaUkraineUnited Arab EmiratesUnited KingdomUnited StatesUpper middle incomeUruguayUzbekistanVanuatuVenezuela, RBVietnamWorldYemen, Rep.ZambiaZimbabwe Timeline:
This timeline shows a graph from 1961 to 2016 of Morocco. No data until 1960. Number of actual observations by date: 56.
Source name:
World Development Indicators
Source organization:
World Trade Organization.
Categories, topics:
Private Sector, Trade
Last updated:
apr 23, 2017
Indicators value changes by year
Minimum:
413.003 mln
jan 1, 1961
Maximum:
45.832 bln
jan 1, 2015
At the date of observation
Value
Absolute change
Change from previous value
jan 1, 1961
413.003 mln
+413.003 mln
0.0%
jan 1, 1962
452.13 mln
+39.127 mln
9.47%
jan 1, 1963
433.752 mln
-18.378 mln
-4.06%
jan 1, 1964
448.771 mln
+15.019 mln
3.46%
jan 1, 1965
461.615 mln
+12.844 mln
2.86%
jan 1, 1966
452.723 mln
-8.892 mln
-1.93%
jan 1, 1967
477.819 mln
+25.096 mln
5.54%
jan 1, 1968
517.736 mln
+39.917 mln
8.35%
jan 1, 1969
551.923 mln
+34.187 mln
6.6%
jan 1, 1970
562.001 mln
+10.078 mln
1.83%
jan 1, 1971
684.321 mln
+122.32 mln
21.77%
jan 1, 1972
700.535 mln
+16.214 mln
2.37%
jan 1, 1973
779.129 mln
+78.594 mln
11.22%
jan 1, 1974
1.144 bln
+364.771 mln
46.82%
jan 1, 1975
1.904 bln
+759.68 mln
66.41%
jan 1, 1976
2.568 bln
+664.0 mln
34.88%
jan 1, 1977
2.618 bln
+50.26 mln
1.96%
jan 1, 1978
3.199 bln
+581.25 mln
22.2%
jan 1, 1979
2.97 bln
-229.18 mln
-7.16%
jan 1, 1980
3.678 bln
+708.39 mln
23.85%
jan 1, 1981
4.164 bln
+485.7 mln
13.2%
jan 1, 1982
4.411 bln
+247.0 mln
5.93%
jan 1, 1983
4.315 bln
-96.0 mln
-2.18%
jan 1, 1984
3.592 bln
-723.0 mln
-16.76%
jan 1, 1985
3.911 bln
+319.0 mln
8.88%
jan 1, 1986
3.849 bln
-62.0 mln
-1.59%
jan 1, 1987
3.803 bln
-46.0 mln
-1.2%
jan 1, 1988
4.23 bln
+427.0 mln
11.23%
jan 1, 1989
4.773 bln
+543.0 mln
12.84%
jan 1, 1990
5.493 bln
+720.0 mln
15.08%
jan 1, 1991
6.922 bln
+1.429 bln
26.01%
jan 1, 1992
6.873 bln
-49.0 mln
-0.71%
jan 1, 1993
7.348 bln
+475.0 mln
6.91%
jan 1, 1994
6.732 bln
-616.0 mln
-8.38%
jan 1, 1995
8.272 bln
+1.54 bln
22.88%
jan 1, 1996
10.023 bln
+1.751 bln
21.17%
jan 1, 1997
9.704 bln
-319.0 mln
-3.18%
jan 1, 1998
9.525 bln
-179.0 mln
-1.84%
jan 1, 1999
10.29 bln
+765.0 mln
8.03%
jan 1, 2000
9.925 bln
-365.0 mln
-3.55%
jan 1, 2001
11.534 bln
+1.609 bln
16.21%
jan 1, 2002
11.038 bln
-496.0 mln
-4.3%
jan 1, 2003
11.864 bln
+825.7 mln
7.48%
jan 1, 2004
14.25 bln
+2.386 bln
20.12%
jan 1, 2005
17.822 bln
+3.572 bln
25.07%
jan 1, 2006
20.79 bln
+2.968 bln
16.65%
jan 1, 2007
23.98 bln
+3.19 bln
15.34%
jan 1, 2008
32.01 bln
+8.03 bln
33.49%
jan 1, 2009
42.366 bln
+10.356 bln
32.35%
jan 1, 2010
32.881 bln
-9.485 bln
-22.39%
jan 1, 2011
35.381 bln
+2.5 bln
7.6%
jan 1, 2012
44.272 bln
+8.891 bln
25.13%
jan 1, 2013
44.872 bln
+599.755 mln
1.35%
jan 1, 2014
45.19 bln
+317.949 mln
0.71%
jan 1, 2015
45.832 bln
+641.652 mln
1.42%
jan 1, 2016
37.514 bln
-8.318 bln
-18.15%
Ranking of countries by current statistics by years


Comments: