29
/
en
AIzaSyAYiBZKx7MnpbEhh9jyipgxe19OcubqV5w
April 1, 2024
91438
Brazil
BRA
true
2
1
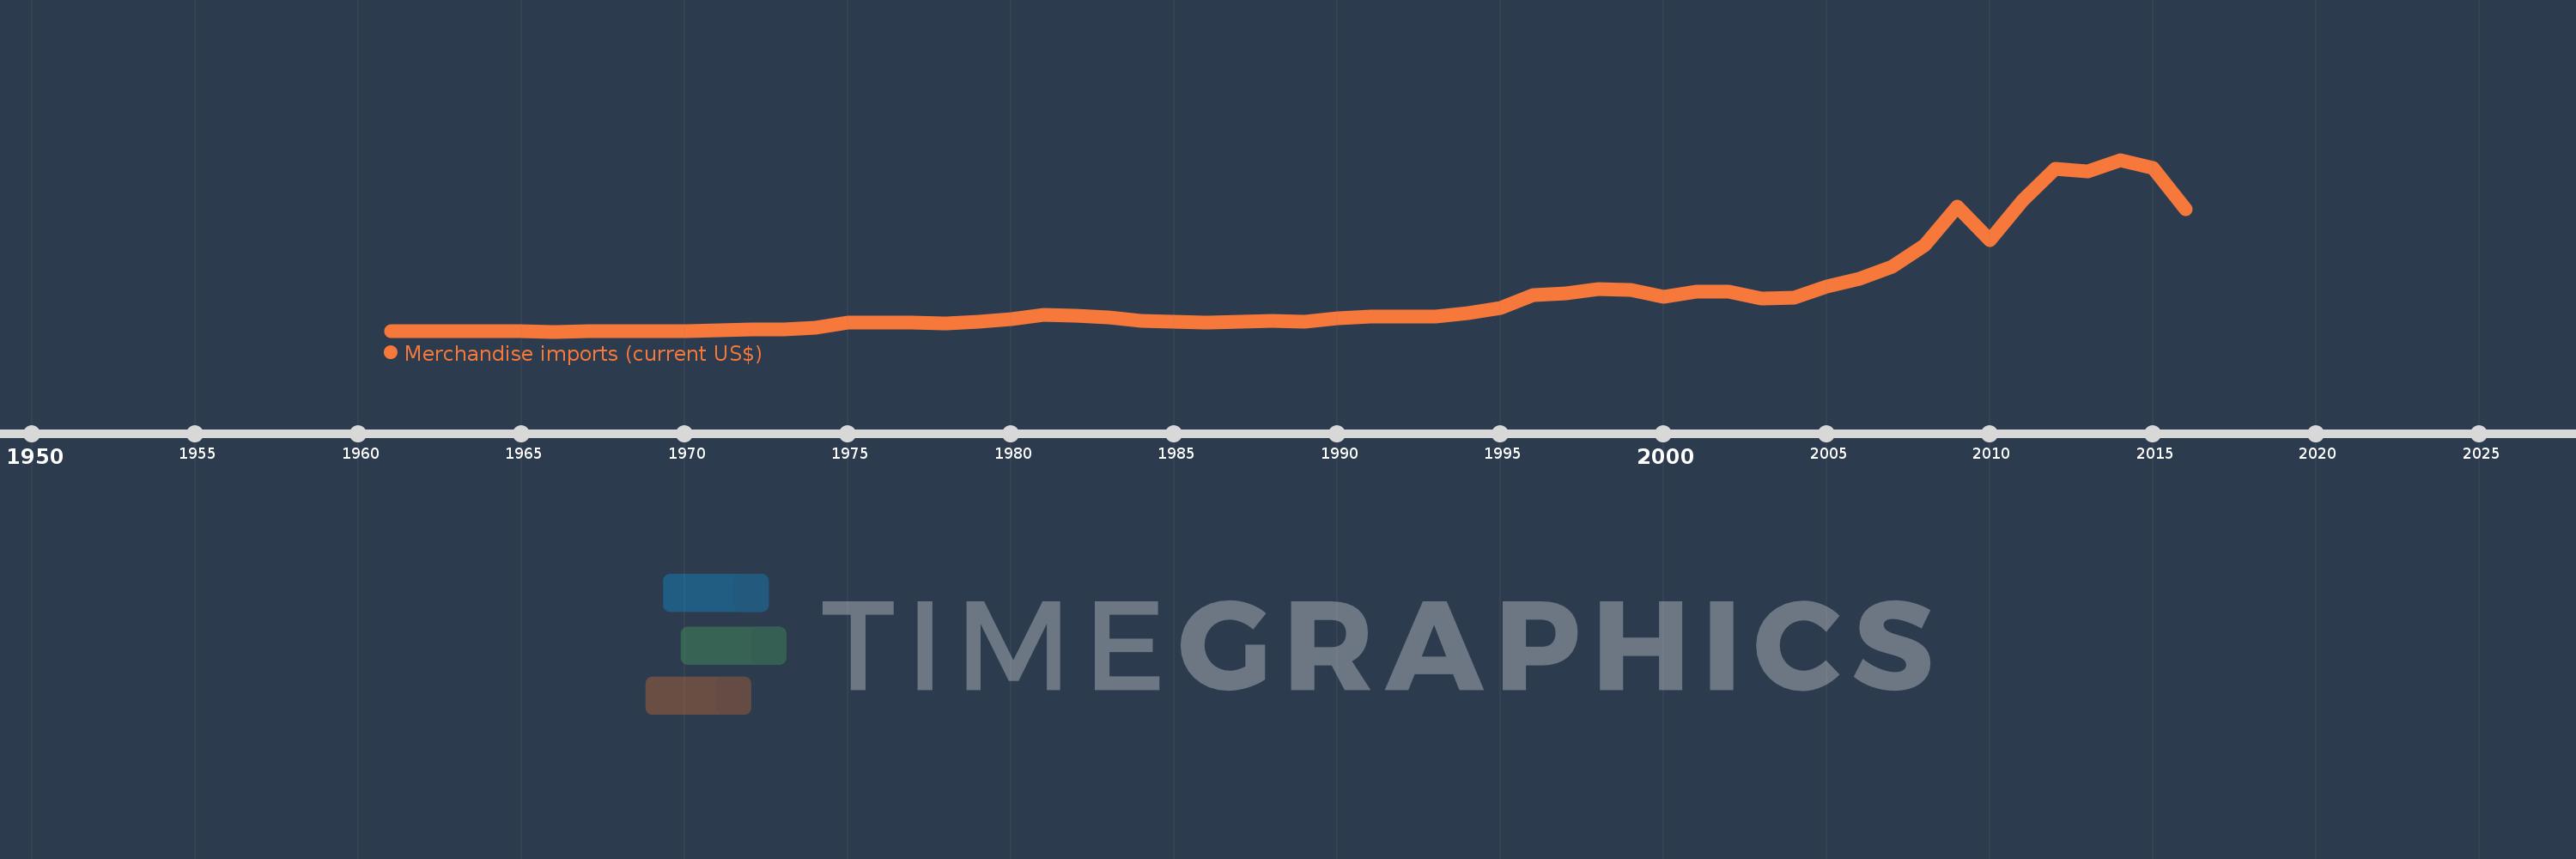
Merchandise imports (current US$)
2016,2015,2014,2013,2012,2011,2010,2009,2008,2007,2006,2005,2004,2003,2002,2001,2000,1999,1998,1997,1996,1995,1994,1993,1992,1991,1990,1989,1988,1987,1986,1985,1984,1983,1982,1981,1980,1979,1978,1977,1976,1975,1974,1973,1972,1971,1970,1969,1968,1967,1966,1965,1964,1963,1962,1961
This statistics in other country:
AfghanistanAlbaniaAlgeriaAmerican SamoaAngolaAntigua and BarbudaArab WorldArgentinaArmeniaArubaAustraliaAustriaAzerbaijanBahamas, TheBahrainBangladeshBarbadosBelarusBelgiumBelizeBeninBermudaBhutanBoliviaBosnia and HerzegovinaBotswanaBrazilBrunei DarussalamBulgariaBurkina FasoBurundiCabo VerdeCambodiaCameroonCanadaCaribbean small statesCentral African RepublicCentral Europe and the BalticsChadChileChinaColombiaComorosCongo, Dem. Rep.Congo, Rep.Costa RicaCote d'IvoireCroatiaCubaCuracaoCyprusCzech RepublicDenmarkDjiboutiDominicaDominican RepublicEarly-demographic dividendEast Asia & PacificEast Asia & Pacific (excluding high income)East Asia & Pacific (IDA & IBRD countries)EcuadorEgypt, Arab Rep.El SalvadorEquatorial GuineaEritreaEstoniaEthiopiaEuro areaEurope & Central AsiaEurope & Central Asia (excluding high income)Europe & Central Asia (IDA & IBRD countries)European UnionFaroe IslandsFijiFinlandFragile and conflict affected situationsFranceFrench PolynesiaGabonGambia, TheGeorgiaGermanyGhanaGreeceGreenlandGrenadaGuatemalaGuineaGuinea-BissauGuyanaHaitiHeavily indebted poor countries (HIPC)High incomeHondurasHong Kong SAR, ChinaHungaryIBRD onlyIcelandIDA & IBRD totalIDA blendIDA onlyIDA totalIndiaIndonesiaIran, Islamic Rep.IraqIrelandIsraelItalyJamaicaJapanJordanKazakhstanKenyaKiribatiKorea, Dem. People’s Rep.Korea, Rep.KuwaitKyrgyz RepublicLao PDRLate-demographic dividendLatin America & Caribbean Latin America & Caribbean (excluding high income)Latin America & the Caribbean (IDA & IBRD countries)LatviaLeast developed countries: UN classificationLebanonLesothoLiberiaLibyaLithuaniaLow & middle incomeLow incomeLower middle incomeLuxembourgMacao SAR, ChinaMacedonia, FYRMadagascarMalawiMalaysiaMaldivesMaliMaltaMarshall IslandsMauritaniaMauritiusMexicoMicronesia, Fed. Sts.Middle East & North AfricaMiddle East & North Africa (excluding high income)Middle East & North Africa (IDA & IBRD countries)Middle incomeMoldovaMongoliaMontenegroMoroccoMozambiqueMyanmarNamibiaNepalNetherlandsNew CaledoniaNew ZealandNicaraguaNigerNigeriaNorth AmericaNorthern Mariana IslandsNorwayOECD membersOmanOther small statesPacific island small statesPakistanPalauPanamaPapua New GuineaParaguayPeruPhilippinesPolandPortugalPost-demographic dividendPre-demographic dividendQatarRomaniaRussian FederationRwandaSamoaSao Tome and PrincipeSaudi ArabiaSenegalSerbiaSeychellesSierra LeoneSingaporeSint Maarten (Dutch part)Slovak RepublicSloveniaSmall statesSolomon IslandsSouth AfricaSouth AsiaSouth Asia (IDA & IBRD)SpainSri LankaSt. Kitts and NevisSt. LuciaSt. Martin (French part)St. Vincent and the GrenadinesSub-Saharan Africa Sub-Saharan Africa (excluding high income)Sub-Saharan Africa (IDA & IBRD countries)SudanSurinameSwazilandSwedenSwitzerlandSyrian Arab RepublicTajikistanTanzaniaThailandTimor-LesteTogoTongaTrinidad and TobagoTunisiaTurkeyTurkmenistanTuvaluUgandaUkraineUnited Arab EmiratesUnited KingdomUnited StatesUpper middle incomeUruguayUzbekistanVanuatuVenezuela, RBVietnamWorldYemen, Rep.ZambiaZimbabwe Timeline:
This timeline shows a graph from 1961 to 2016 of Brazil. No data until 1960. Number of actual observations by date: 56.
Source name:
World Development Indicators
Source organization:
World Trade Organization.
Categories, topics:
Private Sector, Trade
Last updated:
apr 23, 2017
Indicators value changes by year
Minimum:
1.096 bln
jan 1, 1966
Maximum:
250.556 bln
jan 1, 2014
At the date of observation
Value
Absolute change
Change from previous value
jan 1, 1961
1.462 bln
+1.462 bln
0.0%
jan 1, 1962
1.46 bln
-2.0 mln
-0.14%
jan 1, 1963
1.475 bln
+15.0 mln
1.03%
jan 1, 1964
1.487 bln
+12.0 mln
0.81%
jan 1, 1965
1.263 bln
-224.0 mln
-15.06%
jan 1, 1966
1.096 bln
-167.0 mln
-13.22%
jan 1, 1967
1.496 bln
+400.0 mln
36.5%
jan 1, 1968
1.667 bln
+171.0 mln
11.43%
jan 1, 1969
2.132 bln
+465.0 mln
27.89%
jan 1, 1970
2.265 bln
+133.0 mln
6.24%
jan 1, 1971
2.849 bln
+584.0 mln
25.78%
jan 1, 1972
3.701 bln
+852.0 mln
29.91%
jan 1, 1973
4.783 bln
+1.082 bln
29.24%
jan 1, 1974
6.999 bln
+2.216 bln
46.33%
jan 1, 1975
14.168 bln
+7.169 bln
102.43%
jan 1, 1976
13.592 bln
-576.0 mln
-4.07%
jan 1, 1977
13.726 bln
+134.0 mln
0.99%
jan 1, 1978
13.257 bln
-469.0 mln
-3.42%
jan 1, 1979
15.054 bln
+1.797 bln
13.56%
jan 1, 1980
19.804 bln
+4.75 bln
31.55%
jan 1, 1981
24.961 bln
+5.157 bln
26.04%
jan 1, 1982
24.079 bln
-882.0 mln
-3.53%
jan 1, 1983
21.069 bln
-3.01 bln
-12.5%
jan 1, 1984
16.801 bln
-4.268 bln
-20.26%
jan 1, 1985
15.21 bln
-1.591 bln
-9.47%
jan 1, 1986
14.332 bln
-878.0 mln
-5.77%
jan 1, 1987
15.557 bln
+1.225 bln
8.55%
jan 1, 1988
16.581 bln
+1.024 bln
6.58%
jan 1, 1989
16.055 bln
-526.0 mln
-3.17%
jan 1, 1990
19.875 bln
+3.82 bln
23.79%
jan 1, 1991
22.524 bln
+2.649 bln
13.33%
jan 1, 1992
22.95 bln
+426.0 mln
1.89%
jan 1, 1993
23.068 bln
+118.0 mln
0.51%
jan 1, 1994
27.74 bln
+4.672 bln
20.25%
jan 1, 1995
35.997 bln
+8.257 bln
29.77%
jan 1, 1996
54.137 bln
+18.14 bln
50.39%
jan 1, 1997
56.792 bln
+2.655 bln
4.9%
jan 1, 1998
63.291 bln
+6.498 bln
11.44%
jan 1, 1999
61.135 bln
-2.156 bln
-3.41%
jan 1, 2000
51.909 bln
-9.226 bln
-15.09%
jan 1, 2001
59.053 bln
+7.144 bln
13.76%
jan 1, 2002
58.64 bln
-412.4 mln
-0.7%
jan 1, 2003
49.716 bln
-8.924 bln
-15.22%
jan 1, 2004
50.859 bln
+1.143 bln
2.3%
jan 1, 2005
66.433 bln
+15.574 bln
30.62%
jan 1, 2006
77.628 bln
+11.194 bln
16.85%
jan 1, 2007
95.838 bln
+18.21 bln
23.46%
jan 1, 2008
126.645 bln
+30.807 bln
32.15%
jan 1, 2009
182.377 bln
+55.732 bln
44.01%
jan 1, 2010
133.677 bln
-48.7 bln
-26.7%
jan 1, 2011
191.537 bln
+57.86 bln
43.28%
jan 1, 2012
236.964 bln
+45.427 bln
23.72%
jan 1, 2013
233.398 bln
-3.565 bln
-1.5%
jan 1, 2014
250.556 bln
+17.157 bln
7.35%
jan 1, 2015
239.152 bln
-11.403 bln
-4.55%
jan 1, 2016
178.798 bln
-60.354 bln
-25.24%
Ranking of countries by current statistics by years


Comments: