29
/
en
AIzaSyAYiBZKx7MnpbEhh9jyipgxe19OcubqV5w
April 1, 2024
239560
Sierra Leone
SLE
true
2
1
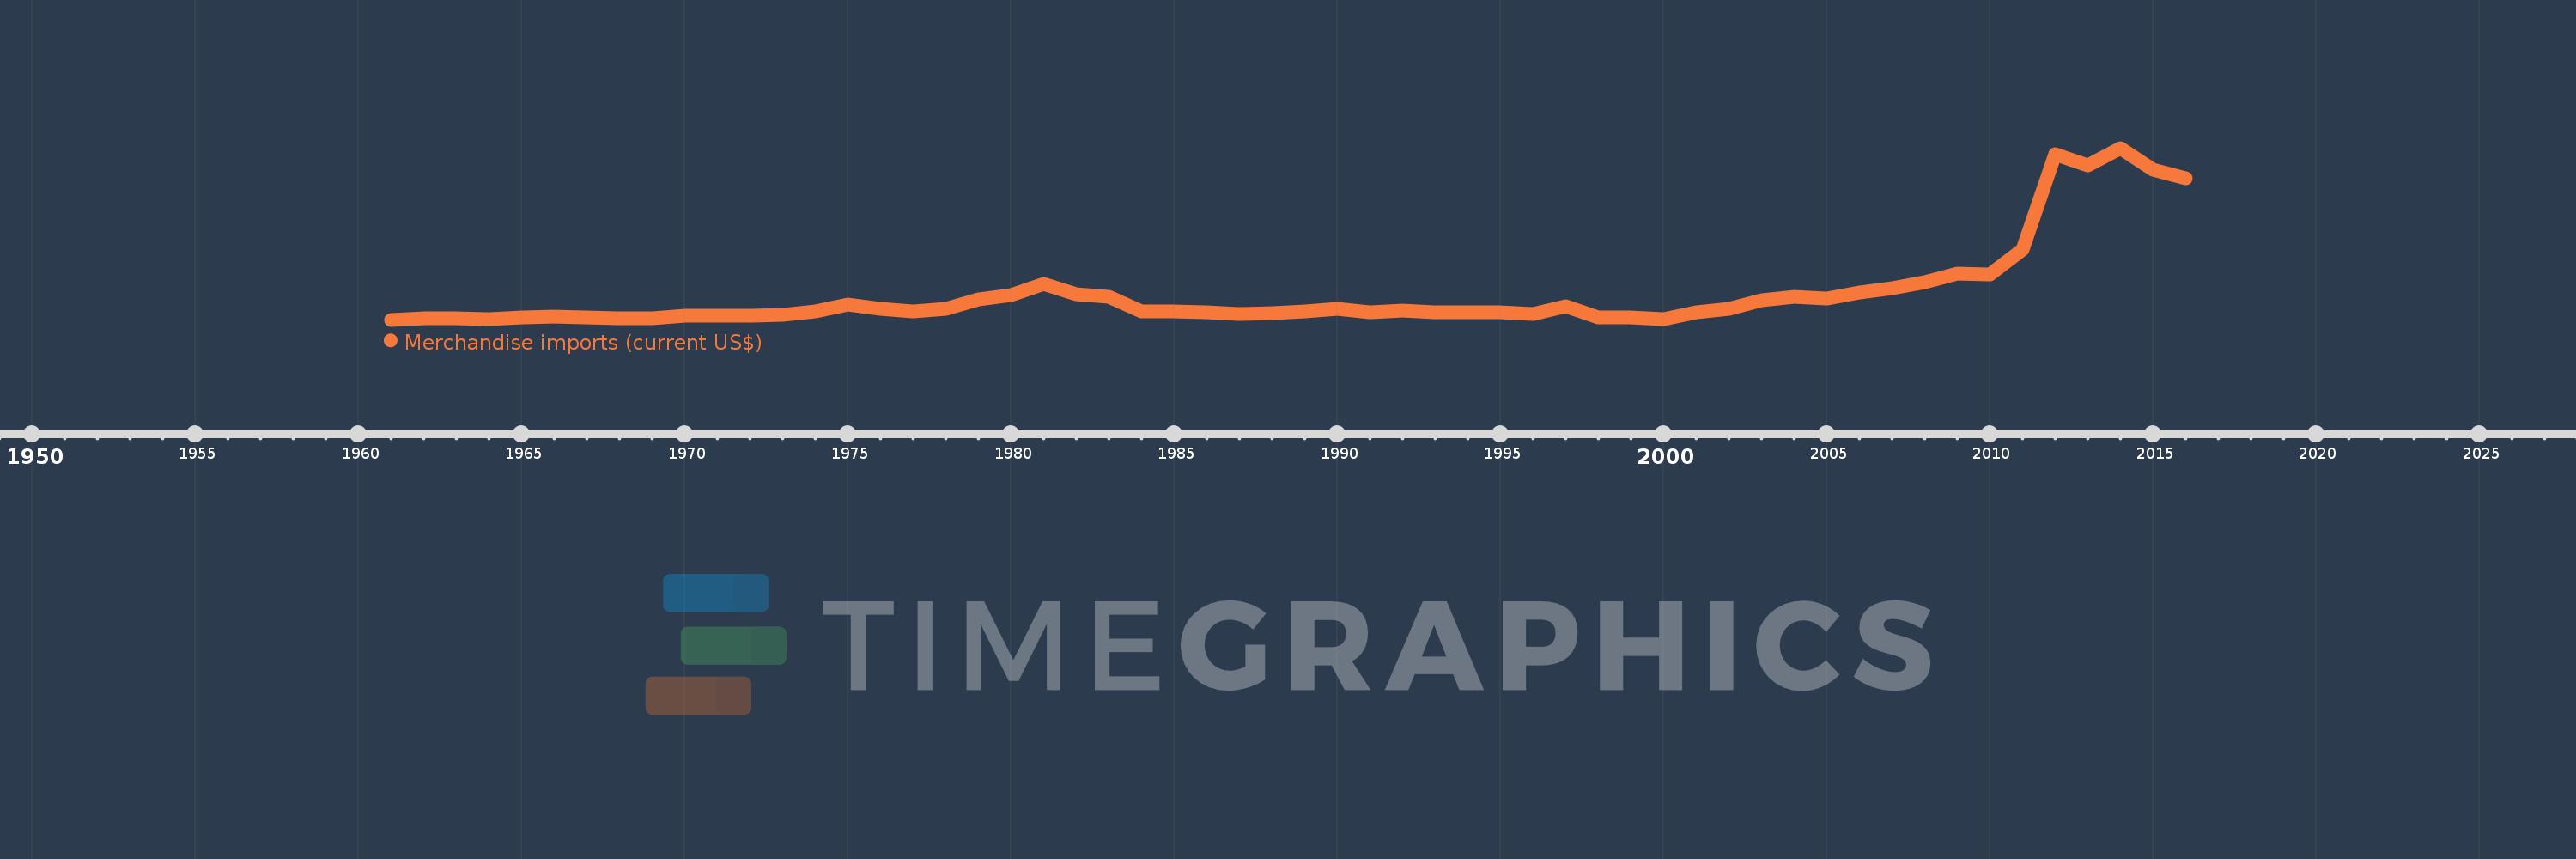
Merchandise imports (current US$)
2016,2015,2014,2013,2012,2011,2010,2009,2008,2007,2006,2005,2004,2003,2002,2001,2000,1999,1998,1997,1996,1995,1994,1993,1992,1991,1990,1989,1988,1987,1986,1985,1984,1983,1982,1981,1980,1979,1978,1977,1976,1975,1974,1973,1972,1971,1970,1969,1968,1967,1966,1965,1964,1963,1962,1961
This statistics in other country:
AfghanistanAlbaniaAlgeriaAmerican SamoaAngolaAntigua and BarbudaArab WorldArgentinaArmeniaArubaAustraliaAustriaAzerbaijanBahamas, TheBahrainBangladeshBarbadosBelarusBelgiumBelizeBeninBermudaBhutanBoliviaBosnia and HerzegovinaBotswanaBrazilBrunei DarussalamBulgariaBurkina FasoBurundiCabo VerdeCambodiaCameroonCanadaCaribbean small statesCentral African RepublicCentral Europe and the BalticsChadChileChinaColombiaComorosCongo, Dem. Rep.Congo, Rep.Costa RicaCote d'IvoireCroatiaCubaCuracaoCyprusCzech RepublicDenmarkDjiboutiDominicaDominican RepublicEarly-demographic dividendEast Asia & PacificEast Asia & Pacific (excluding high income)East Asia & Pacific (IDA & IBRD countries)EcuadorEgypt, Arab Rep.El SalvadorEquatorial GuineaEritreaEstoniaEthiopiaEuro areaEurope & Central AsiaEurope & Central Asia (excluding high income)Europe & Central Asia (IDA & IBRD countries)European UnionFaroe IslandsFijiFinlandFragile and conflict affected situationsFranceFrench PolynesiaGabonGambia, TheGeorgiaGermanyGhanaGreeceGreenlandGrenadaGuatemalaGuineaGuinea-BissauGuyanaHaitiHeavily indebted poor countries (HIPC)High incomeHondurasHong Kong SAR, ChinaHungaryIBRD onlyIcelandIDA & IBRD totalIDA blendIDA onlyIDA totalIndiaIndonesiaIran, Islamic Rep.IraqIrelandIsraelItalyJamaicaJapanJordanKazakhstanKenyaKiribatiKorea, Dem. People’s Rep.Korea, Rep.KuwaitKyrgyz RepublicLao PDRLate-demographic dividendLatin America & Caribbean Latin America & Caribbean (excluding high income)Latin America & the Caribbean (IDA & IBRD countries)LatviaLeast developed countries: UN classificationLebanonLesothoLiberiaLibyaLithuaniaLow & middle incomeLow incomeLower middle incomeLuxembourgMacao SAR, ChinaMacedonia, FYRMadagascarMalawiMalaysiaMaldivesMaliMaltaMarshall IslandsMauritaniaMauritiusMexicoMicronesia, Fed. Sts.Middle East & North AfricaMiddle East & North Africa (excluding high income)Middle East & North Africa (IDA & IBRD countries)Middle incomeMoldovaMongoliaMontenegroMoroccoMozambiqueMyanmarNamibiaNepalNetherlandsNew CaledoniaNew ZealandNicaraguaNigerNigeriaNorth AmericaNorthern Mariana IslandsNorwayOECD membersOmanOther small statesPacific island small statesPakistanPalauPanamaPapua New GuineaParaguayPeruPhilippinesPolandPortugalPost-demographic dividendPre-demographic dividendQatarRomaniaRussian FederationRwandaSamoaSao Tome and PrincipeSaudi ArabiaSenegalSerbiaSeychellesSierra LeoneSingaporeSint Maarten (Dutch part)Slovak RepublicSloveniaSmall statesSolomon IslandsSouth AfricaSouth AsiaSouth Asia (IDA & IBRD)SpainSri LankaSt. Kitts and NevisSt. LuciaSt. Martin (French part)St. Vincent and the GrenadinesSub-Saharan Africa Sub-Saharan Africa (excluding high income)Sub-Saharan Africa (IDA & IBRD countries)SudanSurinameSwazilandSwedenSwitzerlandSyrian Arab RepublicTajikistanTanzaniaThailandTimor-LesteTogoTongaTrinidad and TobagoTunisiaTurkeyTurkmenistanTuvaluUgandaUkraineUnited Arab EmiratesUnited KingdomUnited StatesUpper middle incomeUruguayUzbekistanVanuatuVenezuela, RBVietnamWorldYemen, Rep.ZambiaZimbabwe Timeline:
This timeline shows a graph from 1961 to 2016 of Sierra Leone. No data until 1960. Number of actual observations by date: 56.
Source name:
World Development Indicators
Source organization:
World Trade Organization.
Categories, topics:
Private Sector, Trade
Last updated:
apr 23, 2017
Indicators value changes by year
Minimum:
73.752 mln
jan 1, 1961
Maximum:
1.78 bln
jan 1, 2014
At the date of observation
Value
Absolute change
Change from previous value
jan 1, 1961
73.752 mln
+73.752 mln
0.0%
jan 1, 1962
91.126 mln
+17.374 mln
23.56%
jan 1, 1963
85.232 mln
-5.894 mln
-6.47%
jan 1, 1964
83.608 mln
-1.624 mln
-1.91%
jan 1, 1965
99.428 mln
+15.82 mln
18.92%
jan 1, 1966
107.758 mln
+8.33 mln
8.38%
jan 1, 1967
100.38 mln
-7.378 mln
-6.85%
jan 1, 1968
90.35 mln
-10.03 mln
-9.99%
jan 1, 1969
90.36 mln
+10.1K
0.01%
jan 1, 1970
111.6 mln
+21.24 mln
23.51%
jan 1, 1971
116.292 mln
+4.692 mln
4.2%
jan 1, 1972
113.153 mln
-3.139 mln
-2.7%
jan 1, 1973
119.121 mln
+5.968 mln
5.27%
jan 1, 1974
155.292 mln
+36.171 mln
30.36%
jan 1, 1975
221.728 mln
+66.436 mln
42.78%
jan 1, 1976
185.166 mln
-36.562 mln
-16.49%
jan 1, 1977
153.072 mln
-32.094 mln
-17.33%
jan 1, 1978
180.654 mln
+27.582 mln
18.02%
jan 1, 1979
278.843 mln
+98.189 mln
54.35%
jan 1, 1980
315.932 mln
+37.089 mln
13.3%
jan 1, 1981
427.0 mln
+111.068 mln
35.16%
jan 1, 1982
328.0 mln
-99.0 mln
-23.19%
jan 1, 1983
298.0 mln
-30.0 mln
-9.15%
jan 1, 1984
160.0 mln
-138.0 mln
-46.31%
jan 1, 1985
157.0 mln
-3.0 mln
-1.88%
jan 1, 1986
151.0 mln
-6.0 mln
-3.82%
jan 1, 1987
132.0 mln
-19.0 mln
-12.58%
jan 1, 1988
137.0 mln
+5.0 mln
3.79%
jan 1, 1989
156.0 mln
+19.0 mln
13.87%
jan 1, 1990
183.0 mln
+27.0 mln
17.31%
jan 1, 1991
149.0 mln
-34.0 mln
-18.58%
jan 1, 1992
163.0 mln
+14.0 mln
9.4%
jan 1, 1993
146.0 mln
-17.0 mln
-10.43%
jan 1, 1994
147.0 mln
+1000.0K
0.68%
jan 1, 1995
150.0 mln
+3.0 mln
2.04%
jan 1, 1996
133.0 mln
-17.0 mln
-11.33%
jan 1, 1997
211.0 mln
+78.0 mln
58.65%
jan 1, 1998
93.0 mln
-118.0 mln
-55.92%
jan 1, 1999
95.0 mln
+2.0 mln
2.15%
jan 1, 2000
81.0 mln
-14.0 mln
-14.74%
jan 1, 2001
149.0 mln
+68.0 mln
83.95%
jan 1, 2002
182.0 mln
+33.0 mln
22.15%
jan 1, 2003
264.284 mln
+82.284 mln
45.21%
jan 1, 2004
303.404 mln
+39.12 mln
14.8%
jan 1, 2005
286.464 mln
-16.94 mln
-5.58%
jan 1, 2006
344.687 mln
+58.223 mln
20.32%
jan 1, 2007
389.0 mln
+44.313 mln
12.86%
jan 1, 2008
444.668 mln
+55.668 mln
14.31%
jan 1, 2009
534.139 mln
+89.471 mln
20.12%
jan 1, 2010
520.304 mln
-13.835 mln
-2.59%
jan 1, 2011
770.037 mln
+249.733 mln
48.0%
jan 1, 2012
1.717 bln
+946.521 mln
122.92%
jan 1, 2013
1.604 bln
-113.027 mln
-6.58%
jan 1, 2014
1.78 bln
+176.412 mln
11.0%
jan 1, 2015
1.568 bln
-211.751 mln
-11.9%
jan 1, 2016
1.477 bln
-91.534 mln
-5.84%
Ranking of countries by current statistics by years


Comments: