29
/
en
AIzaSyAYiBZKx7MnpbEhh9jyipgxe19OcubqV5w
April 1, 2024
43643
Latin America & the Caribbean (IDA & IBRD countries)
TLA
false
2
1
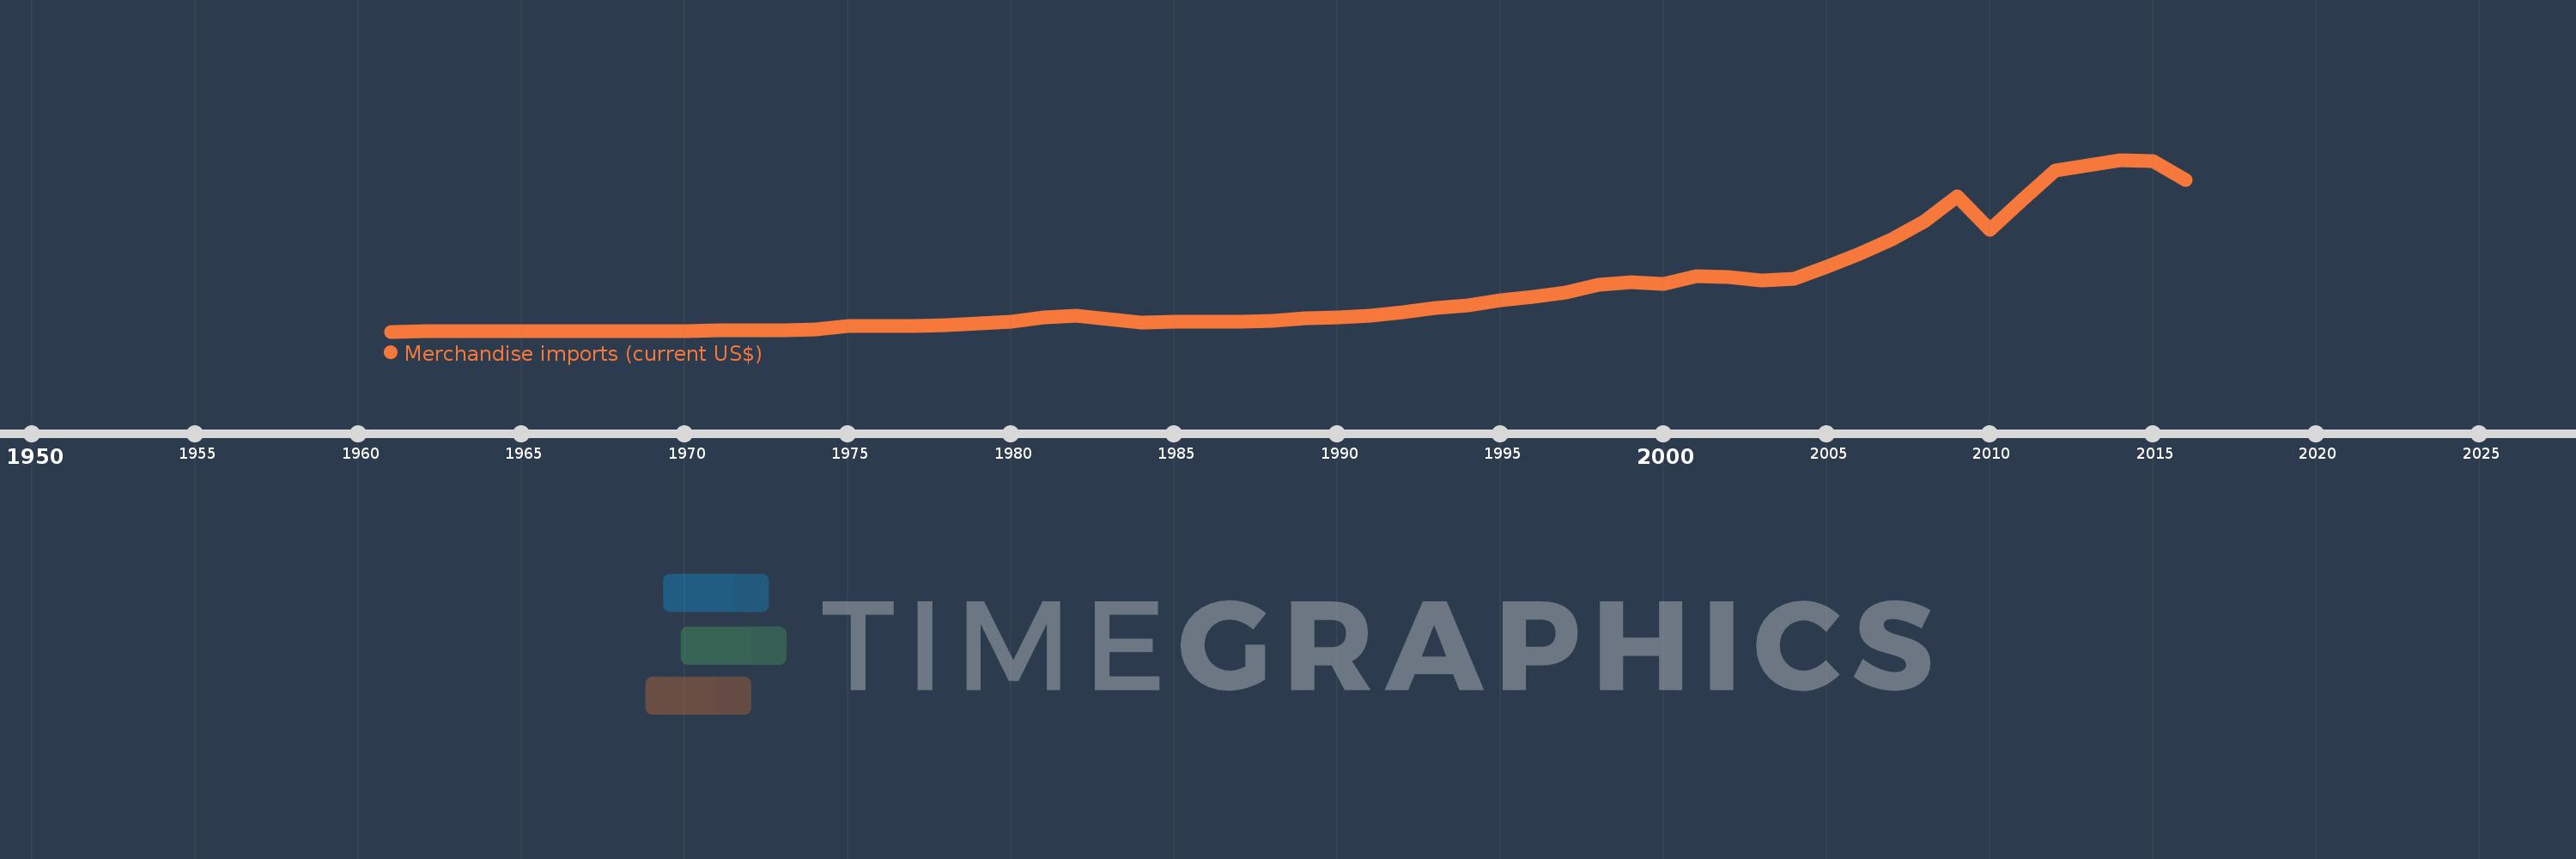
Merchandise imports (current US$)
2016,2015,2014,2013,2012,2011,2010,2009,2008,2007,2006,2005,2004,2003,2002,2001,2000,1999,1998,1997,1996,1995,1994,1993,1992,1991,1990,1989,1988,1987,1986,1985,1984,1983,1982,1981,1980,1979,1978,1977,1976,1975,1974,1973,1972,1971,1970,1969,1968,1967,1966,1965,1964,1963,1962,1961
This statistics in other country:
AfghanistanAlbaniaAlgeriaAmerican SamoaAngolaAntigua and BarbudaArab WorldArgentinaArmeniaArubaAustraliaAustriaAzerbaijanBahamas, TheBahrainBangladeshBarbadosBelarusBelgiumBelizeBeninBermudaBhutanBoliviaBosnia and HerzegovinaBotswanaBrazilBrunei DarussalamBulgariaBurkina FasoBurundiCabo VerdeCambodiaCameroonCanadaCaribbean small statesCentral African RepublicCentral Europe and the BalticsChadChileChinaColombiaComorosCongo, Dem. Rep.Congo, Rep.Costa RicaCote d'IvoireCroatiaCubaCuracaoCyprusCzech RepublicDenmarkDjiboutiDominicaDominican RepublicEarly-demographic dividendEast Asia & PacificEast Asia & Pacific (excluding high income)East Asia & Pacific (IDA & IBRD countries)EcuadorEgypt, Arab Rep.El SalvadorEquatorial GuineaEritreaEstoniaEthiopiaEuro areaEurope & Central AsiaEurope & Central Asia (excluding high income)Europe & Central Asia (IDA & IBRD countries)European UnionFaroe IslandsFijiFinlandFragile and conflict affected situationsFranceFrench PolynesiaGabonGambia, TheGeorgiaGermanyGhanaGreeceGreenlandGrenadaGuatemalaGuineaGuinea-BissauGuyanaHaitiHeavily indebted poor countries (HIPC)High incomeHondurasHong Kong SAR, ChinaHungaryIBRD onlyIcelandIDA & IBRD totalIDA blendIDA onlyIDA totalIndiaIndonesiaIran, Islamic Rep.IraqIrelandIsraelItalyJamaicaJapanJordanKazakhstanKenyaKiribatiKorea, Dem. People’s Rep.Korea, Rep.KuwaitKyrgyz RepublicLao PDRLate-demographic dividendLatin America & Caribbean Latin America & Caribbean (excluding high income)Latin America & the Caribbean (IDA & IBRD countries)LatviaLeast developed countries: UN classificationLebanonLesothoLiberiaLibyaLithuaniaLow & middle incomeLow incomeLower middle incomeLuxembourgMacao SAR, ChinaMacedonia, FYRMadagascarMalawiMalaysiaMaldivesMaliMaltaMarshall IslandsMauritaniaMauritiusMexicoMicronesia, Fed. Sts.Middle East & North AfricaMiddle East & North Africa (excluding high income)Middle East & North Africa (IDA & IBRD countries)Middle incomeMoldovaMongoliaMontenegroMoroccoMozambiqueMyanmarNamibiaNepalNetherlandsNew CaledoniaNew ZealandNicaraguaNigerNigeriaNorth AmericaNorthern Mariana IslandsNorwayOECD membersOmanOther small statesPacific island small statesPakistanPalauPanamaPapua New GuineaParaguayPeruPhilippinesPolandPortugalPost-demographic dividendPre-demographic dividendQatarRomaniaRussian FederationRwandaSamoaSao Tome and PrincipeSaudi ArabiaSenegalSerbiaSeychellesSierra LeoneSingaporeSint Maarten (Dutch part)Slovak RepublicSloveniaSmall statesSolomon IslandsSouth AfricaSouth AsiaSouth Asia (IDA & IBRD)SpainSri LankaSt. Kitts and NevisSt. LuciaSt. Martin (French part)St. Vincent and the GrenadinesSub-Saharan Africa Sub-Saharan Africa (excluding high income)Sub-Saharan Africa (IDA & IBRD countries)SudanSurinameSwazilandSwedenSwitzerlandSyrian Arab RepublicTajikistanTanzaniaThailandTimor-LesteTogoTongaTrinidad and TobagoTunisiaTurkeyTurkmenistanTuvaluUgandaUkraineUnited Arab EmiratesUnited KingdomUnited StatesUpper middle incomeUruguayUzbekistanVanuatuVenezuela, RBVietnamWorldYemen, Rep.ZambiaZimbabwe Timeline:
This timeline shows a graph from 1961 to 2016 of Latin America & the Caribbean (IDA & IBRD countries). No data until 1960. Number of actual observations by date: 56.
Source name:
World Development Indicators
Source organization:
World Trade Organization.
Categories, topics:
Private Sector, Trade
Last updated:
apr 23, 2017
Indicators value changes by year
Minimum:
8.517 bln
jan 1, 1961
Maximum:
1.136 trl
jan 1, 2014
At the date of observation
Value
Absolute change
Change from previous value
jan 1, 1961
8.517 bln
+8.517 bln
0.0%
jan 1, 1962
8.917 bln
+399.793 mln
4.69%
jan 1, 1963
9.155 bln
+238.876 mln
2.68%
jan 1, 1964
8.981 bln
-174.783 mln
-1.91%
jan 1, 1965
9.644 bln
+663.334 mln
7.39%
jan 1, 1966
9.967 bln
+322.738 mln
3.35%
jan 1, 1967
10.953 bln
+986.194 mln
9.89%
jan 1, 1968
11.324 bln
+370.569 mln
3.38%
jan 1, 1969
12.403 bln
+1.079 bln
9.53%
jan 1, 1970
13.574 bln
+1.171 bln
9.44%
jan 1, 1971
15.574 bln
+1.999 bln
14.73%
jan 1, 1972
17.485 bln
+1.911 bln
12.27%
jan 1, 1973
19.578 bln
+2.093 bln
11.97%
jan 1, 1974
25.2 bln
+5.622 bln
28.72%
jan 1, 1975
43.245 bln
+18.045 bln
71.61%
jan 1, 1976
46.366 bln
+3.121 bln
7.22%
jan 1, 1977
47.425 bln
+1.059 bln
2.28%
jan 1, 1978
53.098 bln
+5.674 bln
11.96%
jan 1, 1979
60.602 bln
+7.504 bln
14.13%
jan 1, 1980
75.533 bln
+14.93 bln
24.64%
jan 1, 1981
103.287 bln
+27.754 bln
36.74%
jan 1, 1982
112.022 bln
+8.735 bln
8.46%
jan 1, 1983
88.741 bln
-23.281 bln
-20.78%
jan 1, 1984
67.434 bln
-21.307 bln
-24.01%
jan 1, 1985
70.538 bln
+3.104 bln
4.6%
jan 1, 1986
70.565 bln
+27.0 mln
0.04%
jan 1, 1987
72.015 bln
+1.45 bln
2.05%
jan 1, 1988
81.751 bln
+9.736 bln
13.52%
jan 1, 1989
94.568 bln
+12.817 bln
15.68%
jan 1, 1990
102.367 bln
+7.799 bln
8.25%
jan 1, 1991
115.073 bln
+12.706 bln
12.41%
jan 1, 1992
134.14 bln
+19.067 bln
16.57%
jan 1, 1993
163.933 bln
+29.793 bln
22.21%
jan 1, 1994
181.134 bln
+17.201 bln
10.49%
jan 1, 1995
212.853 bln
+31.719 bln
17.51%
jan 1, 1996
239.167 bln
+26.315 bln
12.36%
jan 1, 1997
266.528 bln
+27.361 bln
11.44%
jan 1, 1998
316.075 bln
+49.547 bln
18.59%
jan 1, 1999
334.602 bln
+18.527 bln
5.86%
jan 1, 2000
322.283 bln
-12.319 bln
-3.68%
jan 1, 2001
374.117 bln
+51.834 bln
16.08%
jan 1, 2002
366.052 bln
-8.065 bln
-2.16%
jan 1, 2003
343.16 bln
-22.892 bln
-6.25%
jan 1, 2004
354.418 bln
+11.258 bln
3.28%
jan 1, 2005
433.012 bln
+78.594 bln
22.18%
jan 1, 2006
517.574 bln
+84.562 bln
19.53%
jan 1, 2007
614.843 bln
+97.269 bln
18.79%
jan 1, 2008
733.708 bln
+118.864 bln
19.33%
jan 1, 2009
896.22 bln
+162.512 bln
22.15%
jan 1, 2010
673.794 bln
-222.426 bln
-24.82%
jan 1, 2011
874.508 bln
+200.714 bln
29.79%
jan 1, 2012
1.067 trl
+192.939 bln
22.06%
jan 1, 2013
1.101 trl
+33.899 bln
3.18%
jan 1, 2014
1.136 trl
+34.351 bln
3.12%
jan 1, 2015
1.127 trl
-8.56 bln
-0.75%
jan 1, 2016
1.002 trl
-124.859 bln
-11.08%
Ranking of countries by current statistics by years


Comments: