29
/
en
AIzaSyAYiBZKx7MnpbEhh9jyipgxe19OcubqV5w
April 1, 2024
185466
Madagascar
MDG
true
2
1
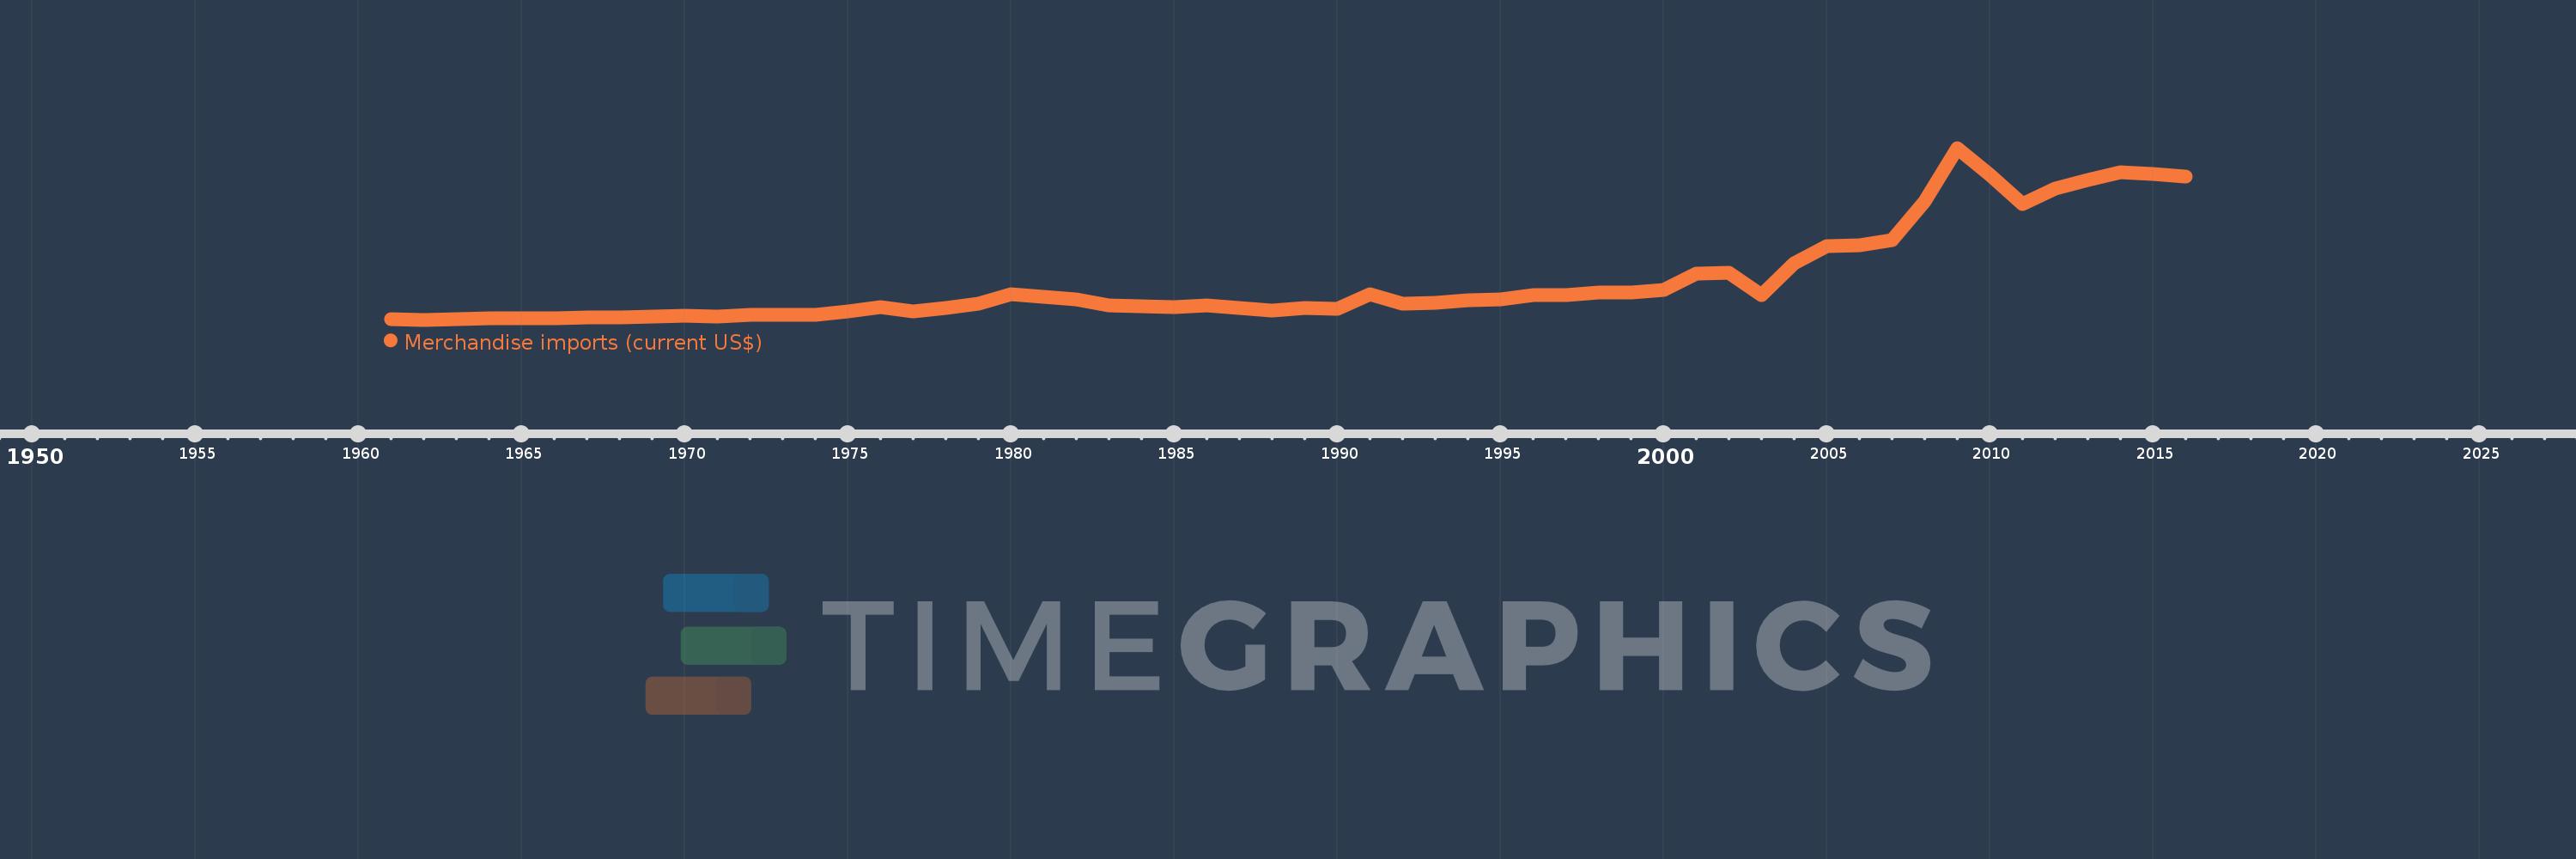
Merchandise imports (current US$)
2016,2015,2014,2013,2012,2011,2010,2009,2008,2007,2006,2005,2004,2003,2002,2001,2000,1999,1998,1997,1996,1995,1994,1993,1992,1991,1990,1989,1988,1987,1986,1985,1984,1983,1982,1981,1980,1979,1978,1977,1976,1975,1974,1973,1972,1971,1970,1969,1968,1967,1966,1965,1964,1963,1962,1961
This statistics in other country:
AfghanistanAlbaniaAlgeriaAmerican SamoaAngolaAntigua and BarbudaArab WorldArgentinaArmeniaArubaAustraliaAustriaAzerbaijanBahamas, TheBahrainBangladeshBarbadosBelarusBelgiumBelizeBeninBermudaBhutanBoliviaBosnia and HerzegovinaBotswanaBrazilBrunei DarussalamBulgariaBurkina FasoBurundiCabo VerdeCambodiaCameroonCanadaCaribbean small statesCentral African RepublicCentral Europe and the BalticsChadChileChinaColombiaComorosCongo, Dem. Rep.Congo, Rep.Costa RicaCote d'IvoireCroatiaCubaCuracaoCyprusCzech RepublicDenmarkDjiboutiDominicaDominican RepublicEarly-demographic dividendEast Asia & PacificEast Asia & Pacific (excluding high income)East Asia & Pacific (IDA & IBRD countries)EcuadorEgypt, Arab Rep.El SalvadorEquatorial GuineaEritreaEstoniaEthiopiaEuro areaEurope & Central AsiaEurope & Central Asia (excluding high income)Europe & Central Asia (IDA & IBRD countries)European UnionFaroe IslandsFijiFinlandFragile and conflict affected situationsFranceFrench PolynesiaGabonGambia, TheGeorgiaGermanyGhanaGreeceGreenlandGrenadaGuatemalaGuineaGuinea-BissauGuyanaHaitiHeavily indebted poor countries (HIPC)High incomeHondurasHong Kong SAR, ChinaHungaryIBRD onlyIcelandIDA & IBRD totalIDA blendIDA onlyIDA totalIndiaIndonesiaIran, Islamic Rep.IraqIrelandIsraelItalyJamaicaJapanJordanKazakhstanKenyaKiribatiKorea, Dem. People’s Rep.Korea, Rep.KuwaitKyrgyz RepublicLao PDRLate-demographic dividendLatin America & Caribbean Latin America & Caribbean (excluding high income)Latin America & the Caribbean (IDA & IBRD countries)LatviaLeast developed countries: UN classificationLebanonLesothoLiberiaLibyaLithuaniaLow & middle incomeLow incomeLower middle incomeLuxembourgMacao SAR, ChinaMacedonia, FYRMadagascarMalawiMalaysiaMaldivesMaliMaltaMarshall IslandsMauritaniaMauritiusMexicoMicronesia, Fed. Sts.Middle East & North AfricaMiddle East & North Africa (excluding high income)Middle East & North Africa (IDA & IBRD countries)Middle incomeMoldovaMongoliaMontenegroMoroccoMozambiqueMyanmarNamibiaNepalNetherlandsNew CaledoniaNew ZealandNicaraguaNigerNigeriaNorth AmericaNorthern Mariana IslandsNorwayOECD membersOmanOther small statesPacific island small statesPakistanPalauPanamaPapua New GuineaParaguayPeruPhilippinesPolandPortugalPost-demographic dividendPre-demographic dividendQatarRomaniaRussian FederationRwandaSamoaSao Tome and PrincipeSaudi ArabiaSenegalSerbiaSeychellesSierra LeoneSingaporeSint Maarten (Dutch part)Slovak RepublicSloveniaSmall statesSolomon IslandsSouth AfricaSouth AsiaSouth Asia (IDA & IBRD)SpainSri LankaSt. Kitts and NevisSt. LuciaSt. Martin (French part)St. Vincent and the GrenadinesSub-Saharan Africa Sub-Saharan Africa (excluding high income)Sub-Saharan Africa (IDA & IBRD countries)SudanSurinameSwazilandSwedenSwitzerlandSyrian Arab RepublicTajikistanTanzaniaThailandTimor-LesteTogoTongaTrinidad and TobagoTunisiaTurkeyTurkmenistanTuvaluUgandaUkraineUnited Arab EmiratesUnited KingdomUnited StatesUpper middle incomeUruguayUzbekistanVanuatuVenezuela, RBVietnamWorldYemen, Rep.ZambiaZimbabwe Timeline:
This timeline shows a graph from 1961 to 2016 of Madagascar. No data until 1960. Number of actual observations by date: 56.
Source name:
World Development Indicators
Source organization:
World Trade Organization.
Categories, topics:
Private Sector, Trade
Last updated:
apr 23, 2017
Indicators value changes by year
Minimum:
103.426 mln
jan 1, 1962
Maximum:
3.781 bln
jan 1, 2009
At the date of observation
Value
Absolute change
Change from previous value
jan 1, 1961
111.56 mln
+111.56 mln
0.0%
jan 1, 1962
103.426 mln
-8.134 mln
-7.29%
jan 1, 1963
121.643 mln
+18.217 mln
17.61%
jan 1, 1964
127.525 mln
+5.882 mln
4.84%
jan 1, 1965
135.514 mln
+7.989 mln
6.26%
jan 1, 1966
138.366 mln
+2.852 mln
2.1%
jan 1, 1967
145.73 mln
+7.364 mln
5.32%
jan 1, 1968
145.37 mln
-360.0K
-0.25%
jan 1, 1969
170.239 mln
+24.869 mln
17.11%
jan 1, 1970
182.364 mln
+12.125 mln
7.12%
jan 1, 1971
170.488 mln
-11.876 mln
-6.51%
jan 1, 1972
214.191 mln
+43.703 mln
25.63%
jan 1, 1973
205.428 mln
-8.763 mln
-4.09%
jan 1, 1974
203.206 mln
-2.222 mln
-1.08%
jan 1, 1975
281.062 mln
+77.856 mln
38.31%
jan 1, 1976
365.738 mln
+84.676 mln
30.13%
jan 1, 1977
285.239 mln
-80.499 mln
-22.01%
jan 1, 1978
347.318 mln
+62.079 mln
21.76%
jan 1, 1979
443.261 mln
+95.943 mln
27.62%
jan 1, 1980
640.719 mln
+197.458 mln
44.55%
jan 1, 1981
600.0 mln
-40.719 mln
-6.36%
jan 1, 1982
545.0 mln
-55.0 mln
-9.17%
jan 1, 1983
417.0 mln
-128.0 mln
-23.49%
jan 1, 1984
387.0 mln
-30.0 mln
-7.19%
jan 1, 1985
366.0 mln
-21.0 mln
-5.43%
jan 1, 1986
402.0 mln
+36.0 mln
9.84%
jan 1, 1987
353.0 mln
-49.0 mln
-12.19%
jan 1, 1988
302.0 mln
-51.0 mln
-14.45%
jan 1, 1989
360.0 mln
+58.0 mln
19.21%
jan 1, 1990
342.0 mln
-18.0 mln
-5.0%
jan 1, 1991
651.0 mln
+309.0 mln
90.35%
jan 1, 1992
446.0 mln
-205.0 mln
-31.49%
jan 1, 1993
471.0 mln
+25.0 mln
5.61%
jan 1, 1994
514.0 mln
+43.0 mln
9.13%
jan 1, 1995
546.0 mln
+32.0 mln
6.23%
jan 1, 1996
628.0 mln
+82.0 mln
15.02%
jan 1, 1997
629.0 mln
+1000.0K
0.16%
jan 1, 1998
694.0 mln
+65.0 mln
10.33%
jan 1, 1999
693.0 mln
-1000.0K
-0.14%
jan 1, 2000
742.0 mln
+49.0 mln
7.07%
jan 1, 2001
1.097 bln
+355.101 mln
47.86%
jan 1, 2002
1.118 bln
+20.755 mln
1.89%
jan 1, 2003
626.703 mln
-491.154 mln
-43.94%
jan 1, 2004
1.304 bln
+677.706 mln
108.14%
jan 1, 2005
1.68 bln
+375.598 mln
28.79%
jan 1, 2006
1.706 bln
+26.321 mln
1.57%
jan 1, 2007
1.804 bln
+97.326 mln
5.7%
jan 1, 2008
2.635 bln
+831.513 mln
46.1%
jan 1, 2009
3.781 bln
+1.146 bln
43.47%
jan 1, 2010
3.199 bln
-581.876 mln
-15.39%
jan 1, 2011
2.584 bln
-615.039 mln
-19.23%
jan 1, 2012
2.905 bln
+321.62 mln
12.45%
jan 1, 2013
3.094 bln
+188.752 mln
6.5%
jan 1, 2014
3.26 bln
+165.349 mln
5.34%
jan 1, 2015
3.227 bln
-32.095 mln
-0.98%
jan 1, 2016
3.173 bln
-54.537 mln
-1.69%
Ranking of countries by current statistics by years


Comments: