29
/
en
AIzaSyAYiBZKx7MnpbEhh9jyipgxe19OcubqV5w
April 1, 2024
117150
Cyprus
CYP
true
2
1
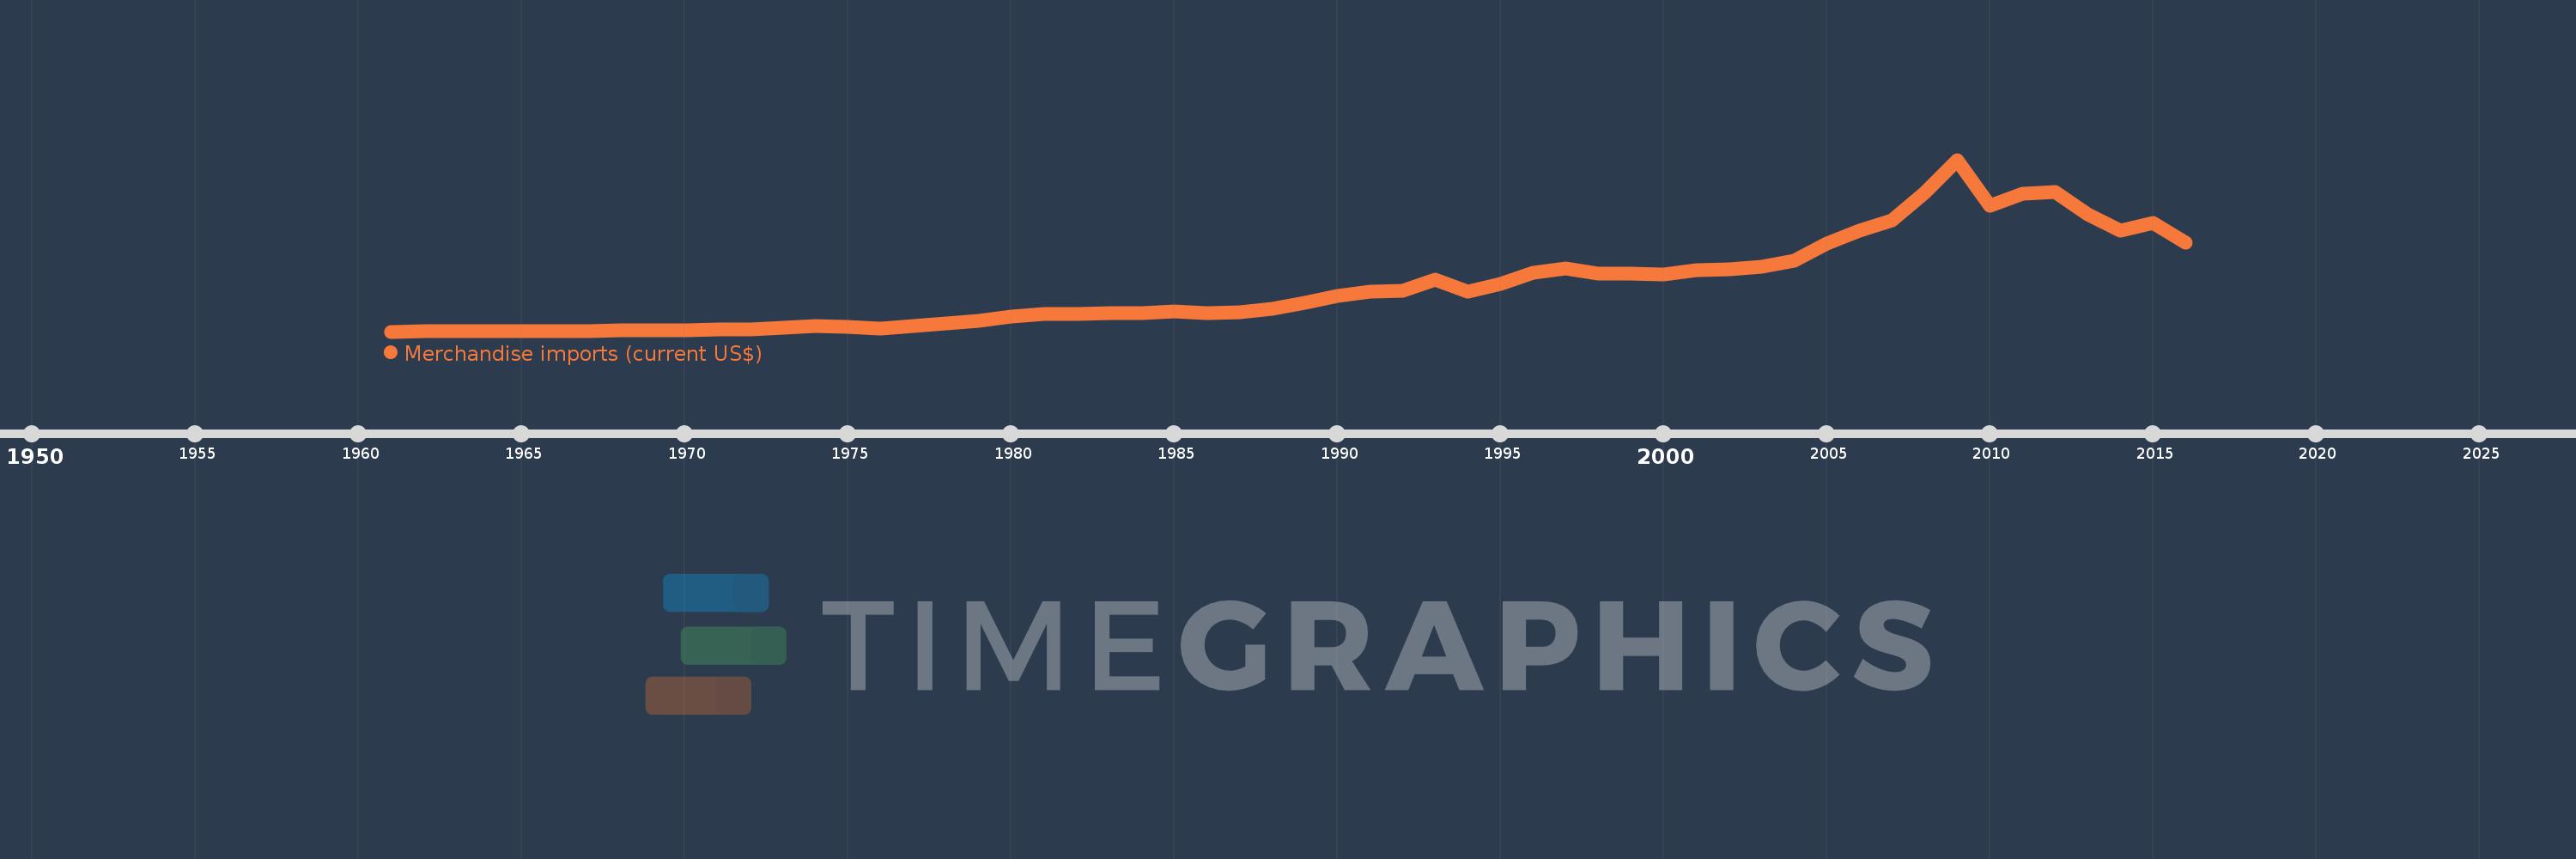
Merchandise imports (current US$)
2016,2015,2014,2013,2012,2011,2010,2009,2008,2007,2006,2005,2004,2003,2002,2001,2000,1999,1998,1997,1996,1995,1994,1993,1992,1991,1990,1989,1988,1987,1986,1985,1984,1983,1982,1981,1980,1979,1978,1977,1976,1975,1974,1973,1972,1971,1970,1969,1968,1967,1966,1965,1964,1963,1962,1961
This statistics in other country:
AfghanistanAlbaniaAlgeriaAmerican SamoaAngolaAntigua and BarbudaArab WorldArgentinaArmeniaArubaAustraliaAustriaAzerbaijanBahamas, TheBahrainBangladeshBarbadosBelarusBelgiumBelizeBeninBermudaBhutanBoliviaBosnia and HerzegovinaBotswanaBrazilBrunei DarussalamBulgariaBurkina FasoBurundiCabo VerdeCambodiaCameroonCanadaCaribbean small statesCentral African RepublicCentral Europe and the BalticsChadChileChinaColombiaComorosCongo, Dem. Rep.Congo, Rep.Costa RicaCote d'IvoireCroatiaCubaCuracaoCyprusCzech RepublicDenmarkDjiboutiDominicaDominican RepublicEarly-demographic dividendEast Asia & PacificEast Asia & Pacific (excluding high income)East Asia & Pacific (IDA & IBRD countries)EcuadorEgypt, Arab Rep.El SalvadorEquatorial GuineaEritreaEstoniaEthiopiaEuro areaEurope & Central AsiaEurope & Central Asia (excluding high income)Europe & Central Asia (IDA & IBRD countries)European UnionFaroe IslandsFijiFinlandFragile and conflict affected situationsFranceFrench PolynesiaGabonGambia, TheGeorgiaGermanyGhanaGreeceGreenlandGrenadaGuatemalaGuineaGuinea-BissauGuyanaHaitiHeavily indebted poor countries (HIPC)High incomeHondurasHong Kong SAR, ChinaHungaryIBRD onlyIcelandIDA & IBRD totalIDA blendIDA onlyIDA totalIndiaIndonesiaIran, Islamic Rep.IraqIrelandIsraelItalyJamaicaJapanJordanKazakhstanKenyaKiribatiKorea, Dem. People’s Rep.Korea, Rep.KuwaitKyrgyz RepublicLao PDRLate-demographic dividendLatin America & Caribbean Latin America & Caribbean (excluding high income)Latin America & the Caribbean (IDA & IBRD countries)LatviaLeast developed countries: UN classificationLebanonLesothoLiberiaLibyaLithuaniaLow & middle incomeLow incomeLower middle incomeLuxembourgMacao SAR, ChinaMacedonia, FYRMadagascarMalawiMalaysiaMaldivesMaliMaltaMarshall IslandsMauritaniaMauritiusMexicoMicronesia, Fed. Sts.Middle East & North AfricaMiddle East & North Africa (excluding high income)Middle East & North Africa (IDA & IBRD countries)Middle incomeMoldovaMongoliaMontenegroMoroccoMozambiqueMyanmarNamibiaNepalNetherlandsNew CaledoniaNew ZealandNicaraguaNigerNigeriaNorth AmericaNorthern Mariana IslandsNorwayOECD membersOmanOther small statesPacific island small statesPakistanPalauPanamaPapua New GuineaParaguayPeruPhilippinesPolandPortugalPost-demographic dividendPre-demographic dividendQatarRomaniaRussian FederationRwandaSamoaSao Tome and PrincipeSaudi ArabiaSenegalSerbiaSeychellesSierra LeoneSingaporeSint Maarten (Dutch part)Slovak RepublicSloveniaSmall statesSolomon IslandsSouth AfricaSouth AsiaSouth Asia (IDA & IBRD)SpainSri LankaSt. Kitts and NevisSt. LuciaSt. Martin (French part)St. Vincent and the GrenadinesSub-Saharan Africa Sub-Saharan Africa (excluding high income)Sub-Saharan Africa (IDA & IBRD countries)SudanSurinameSwazilandSwedenSwitzerlandSyrian Arab RepublicTajikistanTanzaniaThailandTimor-LesteTogoTongaTrinidad and TobagoTunisiaTurkeyTurkmenistanTuvaluUgandaUkraineUnited Arab EmiratesUnited KingdomUnited StatesUpper middle incomeUruguayUzbekistanVanuatuVenezuela, RBVietnamWorldYemen, Rep.ZambiaZimbabwe Timeline:
This timeline shows a graph from 1961 to 2016 of Cyprus. No data until 1960. Number of actual observations by date: 56.
Source name:
World Development Indicators
Source organization:
World Trade Organization.
Categories, topics:
Private Sector, Trade
Last updated:
apr 23, 2017
Indicators value changes by year
Minimum:
103.81 mln
jan 1, 1961
Maximum:
10.644 bln
jan 1, 2009
At the date of observation
Value
Absolute change
Change from previous value
jan 1, 1961
103.81 mln
+103.81 mln
0.0%
jan 1, 1962
107.33 mln
+3.52 mln
3.39%
jan 1, 1963
125.868 mln
+18.538 mln
17.27%
jan 1, 1964
131.995 mln
+6.127 mln
4.87%
jan 1, 1965
105.325 mln
-26.67 mln
-20.21%
jan 1, 1966
143.94 mln
+38.615 mln
36.66%
jan 1, 1967
155.03 mln
+11.09 mln
7.7%
jan 1, 1968
164.545 mln
+9.515 mln
6.14%
jan 1, 1969
170.265 mln
+5.72 mln
3.48%
jan 1, 1970
207.509 mln
+37.244 mln
21.87%
jan 1, 1971
235.749 mln
+28.24 mln
13.61%
jan 1, 1972
260.315 mln
+24.566 mln
10.42%
jan 1, 1973
316.694 mln
+56.379 mln
21.66%
jan 1, 1974
450.605 mln
+133.911 mln
42.28%
jan 1, 1975
406.683 mln
-43.922 mln
-9.75%
jan 1, 1976
308.016 mln
-98.667 mln
-24.26%
jan 1, 1977
432.143 mln
+124.127 mln
40.3%
jan 1, 1978
622.868 mln
+190.725 mln
44.13%
jan 1, 1979
757.96 mln
+135.092 mln
21.69%
jan 1, 1980
1.01 bln
+251.89 mln
33.23%
jan 1, 1981
1.202 bln
+192.15 mln
19.03%
jan 1, 1982
1.166 bln
-36.0 mln
-3.0%
jan 1, 1983
1.223 bln
+57.0 mln
4.89%
jan 1, 1984
1.219 bln
-4.0 mln
-0.33%
jan 1, 1985
1.364 bln
+145.0 mln
11.89%
jan 1, 1986
1.247 bln
-117.0 mln
-8.58%
jan 1, 1987
1.272 bln
+25.0 mln
2.0%
jan 1, 1988
1.484 bln
+212.0 mln
16.67%
jan 1, 1989
1.859 bln
+375.0 mln
25.27%
jan 1, 1990
2.288 bln
+429.0 mln
23.08%
jan 1, 1991
2.568 bln
+280.0 mln
12.24%
jan 1, 1992
2.62 bln
+52.0 mln
2.02%
jan 1, 1993
3.313 bln
+693.0 mln
26.45%
jan 1, 1994
2.533 bln
-780.0 mln
-23.54%
jan 1, 1995
3.017 bln
+484.0 mln
19.11%
jan 1, 1996
3.69 bln
+673.0 mln
22.31%
jan 1, 1997
3.979 bln
+289.0 mln
7.83%
jan 1, 1998
3.655 bln
-324.0 mln
-8.14%
jan 1, 1999
3.685 bln
+30.0 mln
0.82%
jan 1, 2000
3.618 bln
-67.0 mln
-1.82%
jan 1, 2001
3.846 bln
+228.0 mln
6.3%
jan 1, 2002
3.923 bln
+77.0 mln
2.0%
jan 1, 2003
4.086 bln
+163.0 mln
4.15%
jan 1, 2004
4.466 bln
+380.0 mln
9.3%
jan 1, 2005
5.502 bln
+1.036 bln
23.19%
jan 1, 2006
6.316 bln
+814.292 mln
14.8%
jan 1, 2007
6.928 bln
+612.133 mln
9.69%
jan 1, 2008
8.615 bln
+1.687 bln
24.35%
jan 1, 2009
10.644 bln
+2.029 bln
23.55%
jan 1, 2010
7.835 bln
-2.809 bln
-26.39%
jan 1, 2011
8.569 bln
+734.006 mln
9.37%
jan 1, 2012
8.678 bln
+108.538 mln
1.27%
jan 1, 2013
7.296 bln
-1.382 bln
-15.92%
jan 1, 2014
6.314 bln
-981.817 mln
-13.46%
jan 1, 2015
6.761 bln
+447.215 mln
7.08%
jan 1, 2016
5.567 bln
-1.195 bln
-17.67%
Ranking of countries by current statistics by years


Comments: