29
/
en
AIzaSyAYiBZKx7MnpbEhh9jyipgxe19OcubqV5w
April 1, 2024
134364
France
FRA
true
2
1
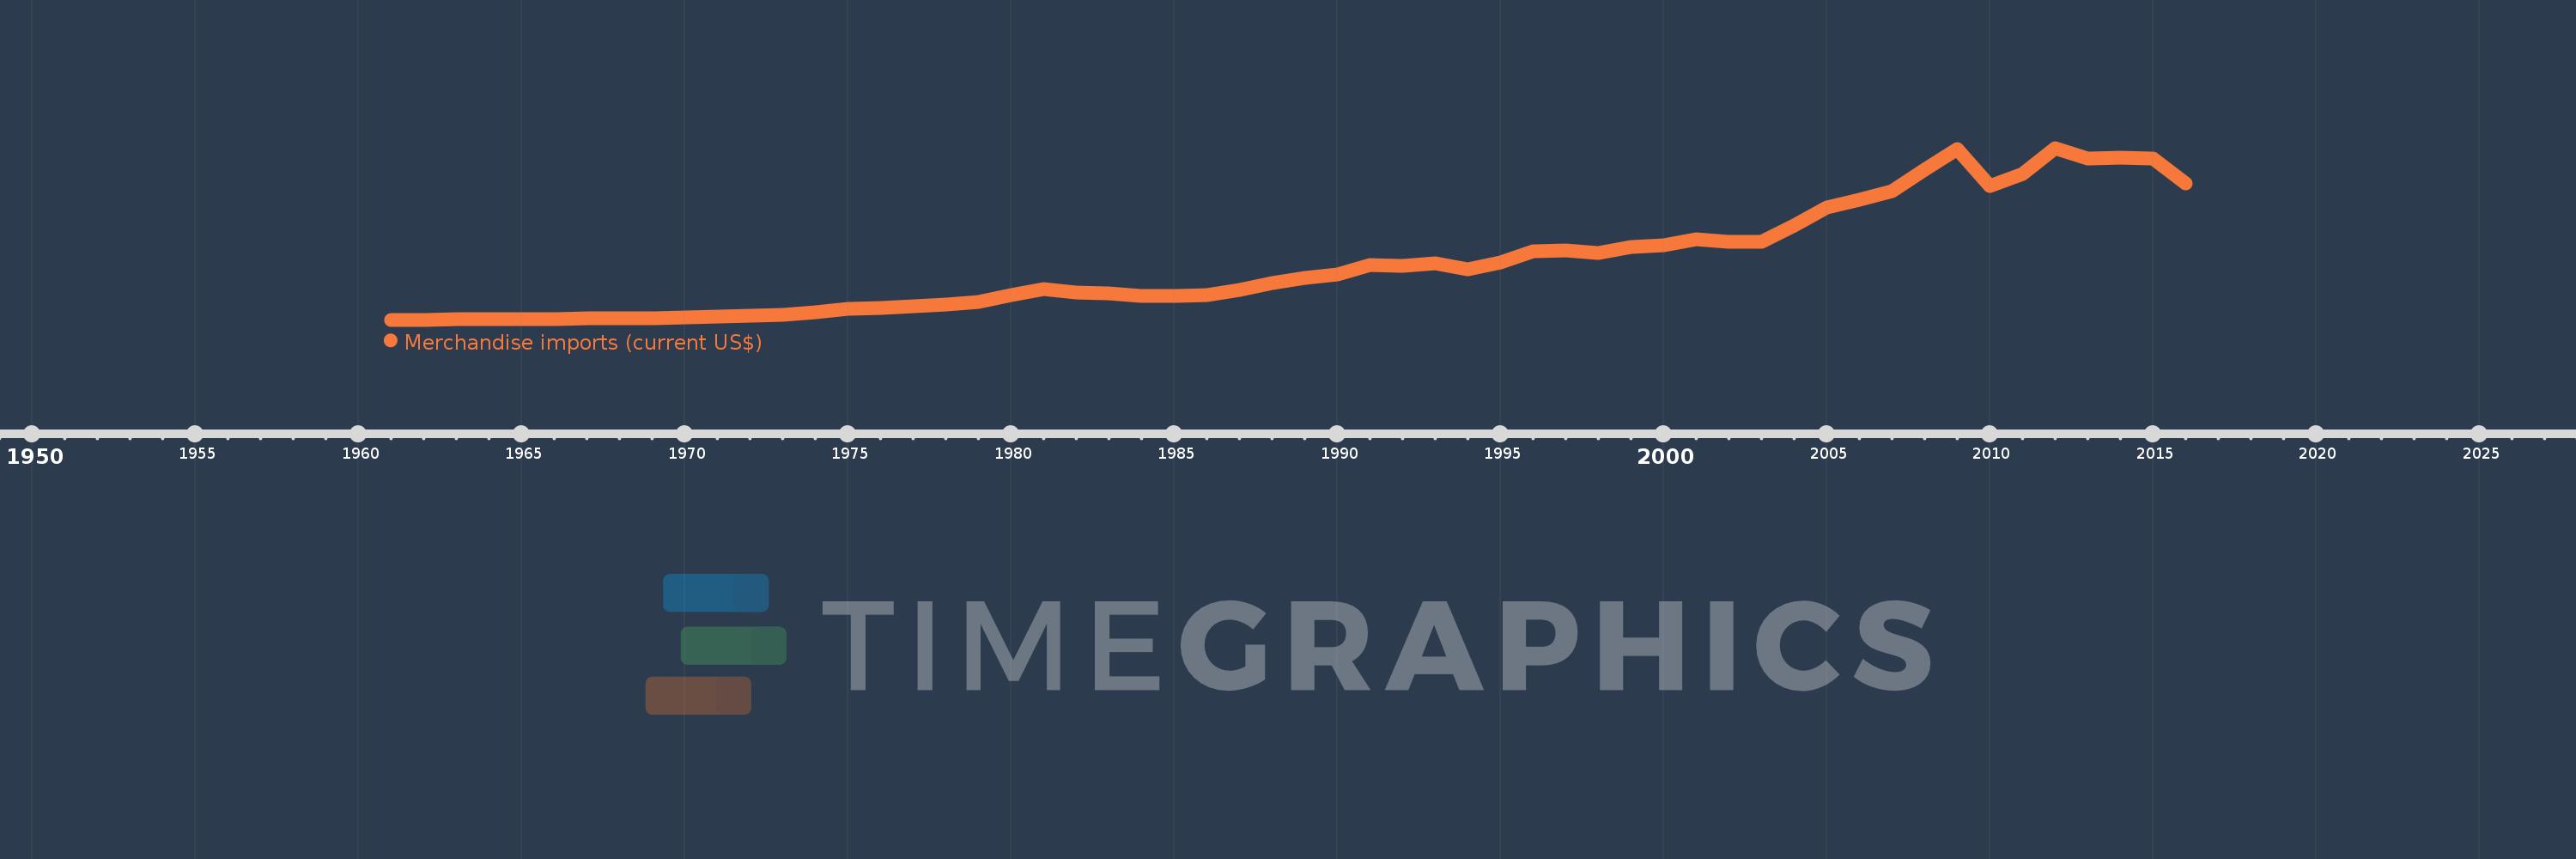
Merchandise imports (current US$)
2016,2015,2014,2013,2012,2011,2010,2009,2008,2007,2006,2005,2004,2003,2002,2001,2000,1999,1998,1997,1996,1995,1994,1993,1992,1991,1990,1989,1988,1987,1986,1985,1984,1983,1982,1981,1980,1979,1978,1977,1976,1975,1974,1973,1972,1971,1970,1969,1968,1967,1966,1965,1964,1963,1962,1961
This statistics in other country:
AfghanistanAlbaniaAlgeriaAmerican SamoaAngolaAntigua and BarbudaArab WorldArgentinaArmeniaArubaAustraliaAustriaAzerbaijanBahamas, TheBahrainBangladeshBarbadosBelarusBelgiumBelizeBeninBermudaBhutanBoliviaBosnia and HerzegovinaBotswanaBrazilBrunei DarussalamBulgariaBurkina FasoBurundiCabo VerdeCambodiaCameroonCanadaCaribbean small statesCentral African RepublicCentral Europe and the BalticsChadChileChinaColombiaComorosCongo, Dem. Rep.Congo, Rep.Costa RicaCote d'IvoireCroatiaCubaCuracaoCyprusCzech RepublicDenmarkDjiboutiDominicaDominican RepublicEarly-demographic dividendEast Asia & PacificEast Asia & Pacific (excluding high income)East Asia & Pacific (IDA & IBRD countries)EcuadorEgypt, Arab Rep.El SalvadorEquatorial GuineaEritreaEstoniaEthiopiaEuro areaEurope & Central AsiaEurope & Central Asia (excluding high income)Europe & Central Asia (IDA & IBRD countries)European UnionFaroe IslandsFijiFinlandFragile and conflict affected situationsFranceFrench PolynesiaGabonGambia, TheGeorgiaGermanyGhanaGreeceGreenlandGrenadaGuatemalaGuineaGuinea-BissauGuyanaHaitiHeavily indebted poor countries (HIPC)High incomeHondurasHong Kong SAR, ChinaHungaryIBRD onlyIcelandIDA & IBRD totalIDA blendIDA onlyIDA totalIndiaIndonesiaIran, Islamic Rep.IraqIrelandIsraelItalyJamaicaJapanJordanKazakhstanKenyaKiribatiKorea, Dem. People’s Rep.Korea, Rep.KuwaitKyrgyz RepublicLao PDRLate-demographic dividendLatin America & Caribbean Latin America & Caribbean (excluding high income)Latin America & the Caribbean (IDA & IBRD countries)LatviaLeast developed countries: UN classificationLebanonLesothoLiberiaLibyaLithuaniaLow & middle incomeLow incomeLower middle incomeLuxembourgMacao SAR, ChinaMacedonia, FYRMadagascarMalawiMalaysiaMaldivesMaliMaltaMarshall IslandsMauritaniaMauritiusMexicoMicronesia, Fed. Sts.Middle East & North AfricaMiddle East & North Africa (excluding high income)Middle East & North Africa (IDA & IBRD countries)Middle incomeMoldovaMongoliaMontenegroMoroccoMozambiqueMyanmarNamibiaNepalNetherlandsNew CaledoniaNew ZealandNicaraguaNigerNigeriaNorth AmericaNorthern Mariana IslandsNorwayOECD membersOmanOther small statesPacific island small statesPakistanPalauPanamaPapua New GuineaParaguayPeruPhilippinesPolandPortugalPost-demographic dividendPre-demographic dividendQatarRomaniaRussian FederationRwandaSamoaSao Tome and PrincipeSaudi ArabiaSenegalSerbiaSeychellesSierra LeoneSingaporeSint Maarten (Dutch part)Slovak RepublicSloveniaSmall statesSolomon IslandsSouth AfricaSouth AsiaSouth Asia (IDA & IBRD)SpainSri LankaSt. Kitts and NevisSt. LuciaSt. Martin (French part)St. Vincent and the GrenadinesSub-Saharan Africa Sub-Saharan Africa (excluding high income)Sub-Saharan Africa (IDA & IBRD countries)SudanSurinameSwazilandSwedenSwitzerlandSyrian Arab RepublicTajikistanTanzaniaThailandTimor-LesteTogoTongaTrinidad and TobagoTunisiaTurkeyTurkmenistanTuvaluUgandaUkraineUnited Arab EmiratesUnited KingdomUnited StatesUpper middle incomeUruguayUzbekistanVanuatuVenezuela, RBVietnamWorldYemen, Rep.ZambiaZimbabwe Timeline:
This timeline shows a graph from 1961 to 2016 of France. No data until 1960. Number of actual observations by date: 56.
Source name:
World Development Indicators
Source organization:
World Trade Organization.
Categories, topics:
Private Sector, Trade
Last updated:
apr 23, 2017
Indicators value changes by year
Minimum:
6.282 bln
jan 1, 1961
Maximum:
720.028 bln
jan 1, 2012
At the date of observation
Value
Absolute change
Change from previous value
jan 1, 1961
6.282 bln
+6.282 bln
0.0%
jan 1, 1962
6.683 bln
+400.24 mln
6.37%
jan 1, 1963
7.378 bln
+695.96 mln
10.41%
jan 1, 1964
8.744 bln
+1.366 bln
18.51%
jan 1, 1965
10.101 bln
+1.357 bln
15.52%
jan 1, 1966
10.384 bln
+283.1 mln
2.8%
jan 1, 1967
11.859 bln
+1.475 bln
14.2%
jan 1, 1968
12.443 bln
+584.1 mln
4.93%
jan 1, 1969
14.018 bln
+1.575 bln
12.66%
jan 1, 1970
17.37 bln
+3.352 bln
23.91%
jan 1, 1971
19.131 bln
+1.761 bln
10.14%
jan 1, 1972
21.336 bln
+2.205 bln
11.53%
jan 1, 1973
26.999 bln
+5.663 bln
26.54%
jan 1, 1974
37.737 bln
+10.738 bln
39.77%
jan 1, 1975
52.918 bln
+15.181 bln
40.23%
jan 1, 1976
53.947 bln
+1.029 bln
1.94%
jan 1, 1977
64.082 bln
+10.135 bln
18.79%
jan 1, 1978
70.637 bln
+6.555 bln
10.23%
jan 1, 1979
81.788 bln
+11.152 bln
15.79%
jan 1, 1980
107.009 bln
+25.221 bln
30.84%
jan 1, 1981
134.866 bln
+27.857 bln
26.03%
jan 1, 1982
120.953 bln
-13.913 bln
-10.32%
jan 1, 1983
115.714 bln
-5.239 bln
-4.33%
jan 1, 1984
105.907 bln
-9.807 bln
-8.48%
jan 1, 1985
104.362 bln
-1.545 bln
-1.46%
jan 1, 1986
108.251 bln
+3.889 bln
3.73%
jan 1, 1987
129.401 bln
+21.15 bln
19.54%
jan 1, 1988
158.476 bln
+29.075 bln
22.47%
jan 1, 1989
178.857 bln
+20.381 bln
12.86%
jan 1, 1990
192.986 bln
+14.129 bln
7.9%
jan 1, 1991
234.436 bln
+41.45 bln
21.48%
jan 1, 1992
231.784 bln
-2.652 bln
-1.13%
jan 1, 1993
239.638 bln
+7.854 bln
3.39%
jan 1, 1994
217.351 bln
-22.287 bln
-9.3%
jan 1, 1995
246.001 bln
+28.65 bln
13.18%
jan 1, 1996
289.391 bln
+43.39 bln
17.64%
jan 1, 1997
294.56 bln
+5.169 bln
1.79%
jan 1, 1998
285.027 bln
-9.533 bln
-3.24%
jan 1, 1999
307.771 bln
+22.744 bln
7.98%
jan 1, 2000
315.748 bln
+7.977 bln
2.59%
jan 1, 2001
338.94 bln
+23.191 bln
7.34%
jan 1, 2002
328.608 bln
-10.332 bln
-3.05%
jan 1, 2003
329.262 bln
+654.16 mln
0.2%
jan 1, 2004
398.84 bln
+69.578 bln
21.13%
jan 1, 2005
470.945 bln
+72.104 bln
18.08%
jan 1, 2006
504.124 bln
+33.18 bln
7.05%
jan 1, 2007
541.919 bln
+37.795 bln
7.5%
jan 1, 2008
630.861 bln
+88.942 bln
16.41%
jan 1, 2009
716.795 bln
+85.934 bln
13.62%
jan 1, 2010
560.873 bln
-155.922 bln
-21.75%
jan 1, 2011
611.07 bln
+50.197 bln
8.95%
jan 1, 2012
720.028 bln
+108.959 bln
17.83%
jan 1, 2013
674.415 bln
-45.613 bln
-6.33%
jan 1, 2014
681.467 bln
+7.052 bln
1.05%
jan 1, 2015
676.603 bln
-4.864 bln
-0.71%
jan 1, 2016
572.661 bln
-103.942 bln
-15.36%
Ranking of countries by current statistics by years


Comments: