29
/
en
AIzaSyAYiBZKx7MnpbEhh9jyipgxe19OcubqV5w
April 1, 2024
227645
Qatar
QAT
true
2
1
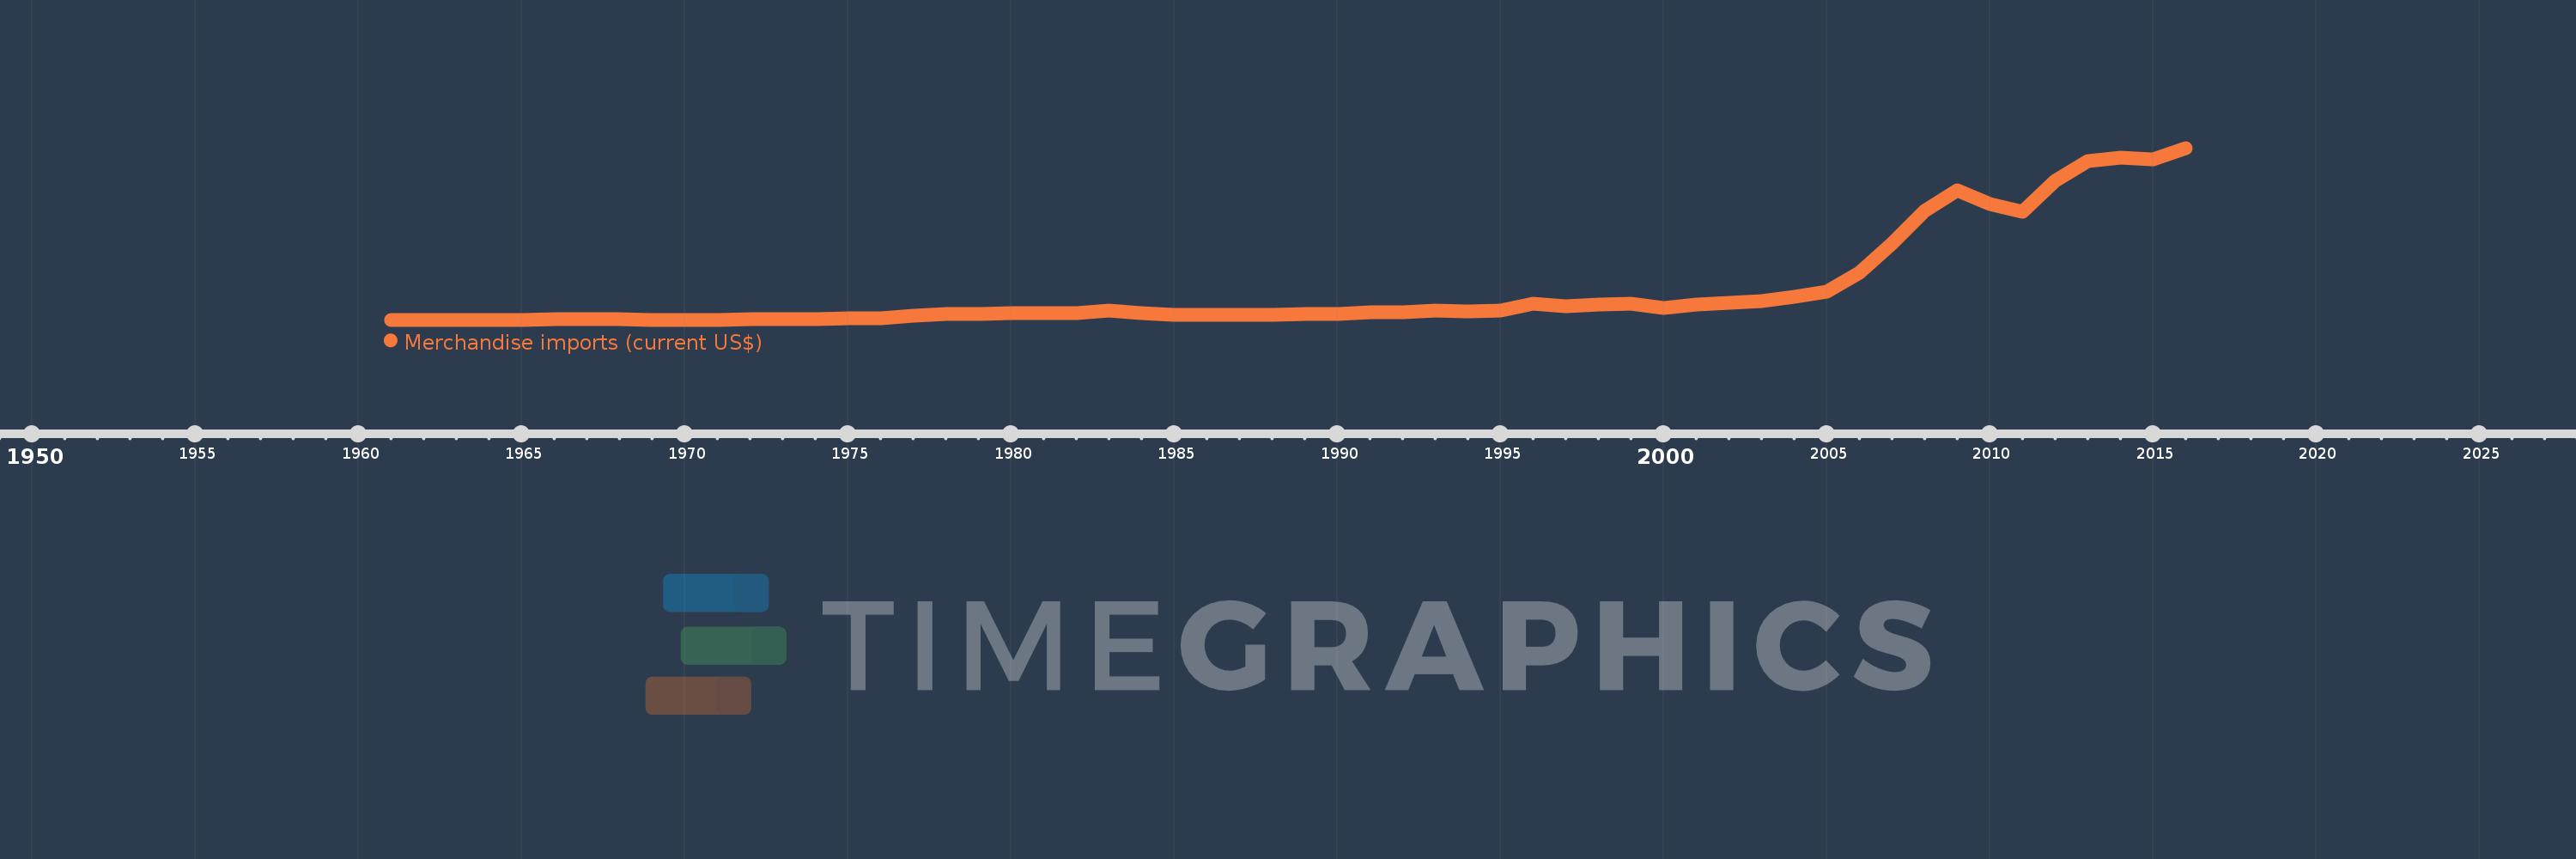
Merchandise imports (current US$)
2016,2015,2014,2013,2012,2011,2010,2009,2008,2007,2006,2005,2004,2003,2002,2001,2000,1999,1998,1997,1996,1995,1994,1993,1992,1991,1990,1989,1988,1987,1986,1985,1984,1983,1982,1981,1980,1979,1978,1977,1976,1975,1974,1973,1972,1971,1970,1969,1968,1967,1966,1965,1964,1963,1962,1961
This statistics in other country:
AfghanistanAlbaniaAlgeriaAmerican SamoaAngolaAntigua and BarbudaArab WorldArgentinaArmeniaArubaAustraliaAustriaAzerbaijanBahamas, TheBahrainBangladeshBarbadosBelarusBelgiumBelizeBeninBermudaBhutanBoliviaBosnia and HerzegovinaBotswanaBrazilBrunei DarussalamBulgariaBurkina FasoBurundiCabo VerdeCambodiaCameroonCanadaCaribbean small statesCentral African RepublicCentral Europe and the BalticsChadChileChinaColombiaComorosCongo, Dem. Rep.Congo, Rep.Costa RicaCote d'IvoireCroatiaCubaCuracaoCyprusCzech RepublicDenmarkDjiboutiDominicaDominican RepublicEarly-demographic dividendEast Asia & PacificEast Asia & Pacific (excluding high income)East Asia & Pacific (IDA & IBRD countries)EcuadorEgypt, Arab Rep.El SalvadorEquatorial GuineaEritreaEstoniaEthiopiaEuro areaEurope & Central AsiaEurope & Central Asia (excluding high income)Europe & Central Asia (IDA & IBRD countries)European UnionFaroe IslandsFijiFinlandFragile and conflict affected situationsFranceFrench PolynesiaGabonGambia, TheGeorgiaGermanyGhanaGreeceGreenlandGrenadaGuatemalaGuineaGuinea-BissauGuyanaHaitiHeavily indebted poor countries (HIPC)High incomeHondurasHong Kong SAR, ChinaHungaryIBRD onlyIcelandIDA & IBRD totalIDA blendIDA onlyIDA totalIndiaIndonesiaIran, Islamic Rep.IraqIrelandIsraelItalyJamaicaJapanJordanKazakhstanKenyaKiribatiKorea, Dem. People’s Rep.Korea, Rep.KuwaitKyrgyz RepublicLao PDRLate-demographic dividendLatin America & Caribbean Latin America & Caribbean (excluding high income)Latin America & the Caribbean (IDA & IBRD countries)LatviaLeast developed countries: UN classificationLebanonLesothoLiberiaLibyaLithuaniaLow & middle incomeLow incomeLower middle incomeLuxembourgMacao SAR, ChinaMacedonia, FYRMadagascarMalawiMalaysiaMaldivesMaliMaltaMarshall IslandsMauritaniaMauritiusMexicoMicronesia, Fed. Sts.Middle East & North AfricaMiddle East & North Africa (excluding high income)Middle East & North Africa (IDA & IBRD countries)Middle incomeMoldovaMongoliaMontenegroMoroccoMozambiqueMyanmarNamibiaNepalNetherlandsNew CaledoniaNew ZealandNicaraguaNigerNigeriaNorth AmericaNorthern Mariana IslandsNorwayOECD membersOmanOther small statesPacific island small statesPakistanPalauPanamaPapua New GuineaParaguayPeruPhilippinesPolandPortugalPost-demographic dividendPre-demographic dividendQatarRomaniaRussian FederationRwandaSamoaSao Tome and PrincipeSaudi ArabiaSenegalSerbiaSeychellesSierra LeoneSingaporeSint Maarten (Dutch part)Slovak RepublicSloveniaSmall statesSolomon IslandsSouth AfricaSouth AsiaSouth Asia (IDA & IBRD)SpainSri LankaSt. Kitts and NevisSt. LuciaSt. Martin (French part)St. Vincent and the GrenadinesSub-Saharan Africa Sub-Saharan Africa (excluding high income)Sub-Saharan Africa (IDA & IBRD countries)SudanSurinameSwazilandSwedenSwitzerlandSyrian Arab RepublicTajikistanTanzaniaThailandTimor-LesteTogoTongaTrinidad and TobagoTunisiaTurkeyTurkmenistanTuvaluUgandaUkraineUnited Arab EmiratesUnited KingdomUnited StatesUpper middle incomeUruguayUzbekistanVanuatuVenezuela, RBVietnamWorldYemen, Rep.ZambiaZimbabwe Timeline:
This timeline shows a graph from 1961 to 2016 of Qatar. No data until 1960. Number of actual observations by date: 56.
Source name:
World Development Indicators
Source organization:
World Trade Organization.
Categories, topics:
Private Sector, Trade
Last updated:
apr 23, 2017
Indicators value changes by year
Minimum:
32.0 mln
jan 1, 1961
Maximum:
37.0 bln
jan 1, 2016
At the date of observation
Value
Absolute change
Change from previous value
jan 1, 1961
32.0 mln
+32.0 mln
0.0%
jan 1, 1962
40.0 mln
+8.0 mln
25.0%
jan 1, 1963
37.0 mln
-3.0 mln
-7.5%
jan 1, 1964
40.0 mln
+3.0 mln
8.11%
jan 1, 1965
50.0 mln
+10.0 mln
25.0%
jan 1, 1966
70.0 mln
+20.0 mln
40.0%
jan 1, 1967
70.0 mln
0.0
0.0%
jan 1, 1968
90.0 mln
+20.0 mln
28.57%
jan 1, 1969
43.0 mln
-47.0 mln
-52.22%
jan 1, 1970
53.004 mln
+10.004 mln
23.27%
jan 1, 1971
64.155 mln
+11.151 mln
21.04%
jan 1, 1972
108.768 mln
+44.613 mln
69.54%
jan 1, 1973
140.539 mln
+31.771 mln
29.21%
jan 1, 1974
195.386 mln
+54.847 mln
39.03%
jan 1, 1975
271.064 mln
+75.678 mln
38.73%
jan 1, 1976
412.971 mln
+141.907 mln
52.35%
jan 1, 1977
816.813 mln
+403.842 mln
97.79%
jan 1, 1978
1.225 bln
+408.327 mln
49.99%
jan 1, 1979
1.185 bln
-40.47 mln
-3.3%
jan 1, 1980
1.424 bln
+239.68 mln
20.23%
jan 1, 1981
1.423 bln
-1.35 mln
-0.09%
jan 1, 1982
1.518 bln
+95.0 mln
6.68%
jan 1, 1983
1.947 bln
+429.0 mln
28.26%
jan 1, 1984
1.456 bln
-491.0 mln
-25.22%
jan 1, 1985
1.162 bln
-294.0 mln
-20.19%
jan 1, 1986
1.139 bln
-23.0 mln
-1.98%
jan 1, 1987
1.099 bln
-40.0 mln
-3.51%
jan 1, 1988
1.161 bln
+62.0 mln
5.64%
jan 1, 1989
1.267 bln
+106.0 mln
9.13%
jan 1, 1990
1.326 bln
+59.0 mln
4.66%
jan 1, 1991
1.695 bln
+369.0 mln
27.83%
jan 1, 1992
1.72 bln
+25.0 mln
1.47%
jan 1, 1993
2.015 bln
+295.0 mln
17.15%
jan 1, 1994
1.891 bln
-124.0 mln
-6.15%
jan 1, 1995
1.927 bln
+36.0 mln
1.9%
jan 1, 1996
3.398 bln
+1.471 bln
76.34%
jan 1, 1997
2.868 bln
-530.0 mln
-15.6%
jan 1, 1998
3.322 bln
+454.0 mln
15.83%
jan 1, 1999
3.409 bln
+87.0 mln
2.62%
jan 1, 2000
2.5 bln
-909.0 mln
-26.66%
jan 1, 2001
3.252 bln
+752.0 mln
30.08%
jan 1, 2002
3.758 bln
+506.0 mln
15.56%
jan 1, 2003
4.052 bln
+294.046 mln
7.82%
jan 1, 2004
4.897 bln
+845.371 mln
20.86%
jan 1, 2005
6.005 bln
+1.107 bln
22.61%
jan 1, 2006
10.061 bln
+4.056 bln
67.56%
jan 1, 2007
16.44 bln
+6.379 bln
63.4%
jan 1, 2008
23.429 bln
+6.989 bln
42.51%
jan 1, 2009
27.9 bln
+4.471 bln
19.08%
jan 1, 2010
24.922 bln
-2.978 bln
-10.67%
jan 1, 2011
23.24 bln
-1.682 bln
-6.75%
jan 1, 2012
29.888 bln
+6.648 bln
28.61%
jan 1, 2013
34.2 bln
+4.312 bln
14.43%
jan 1, 2014
34.9 bln
+700.0 mln
2.05%
jan 1, 2015
34.6 bln
-300.0 mln
-0.86%
jan 1, 2016
37.0 bln
+2.4 bln
6.94%
Ranking of countries by current statistics by years


Comments: