29
/
en
AIzaSyAYiBZKx7MnpbEhh9jyipgxe19OcubqV5w
April 1, 2024
213243
Nigeria
NGA
true
2
1
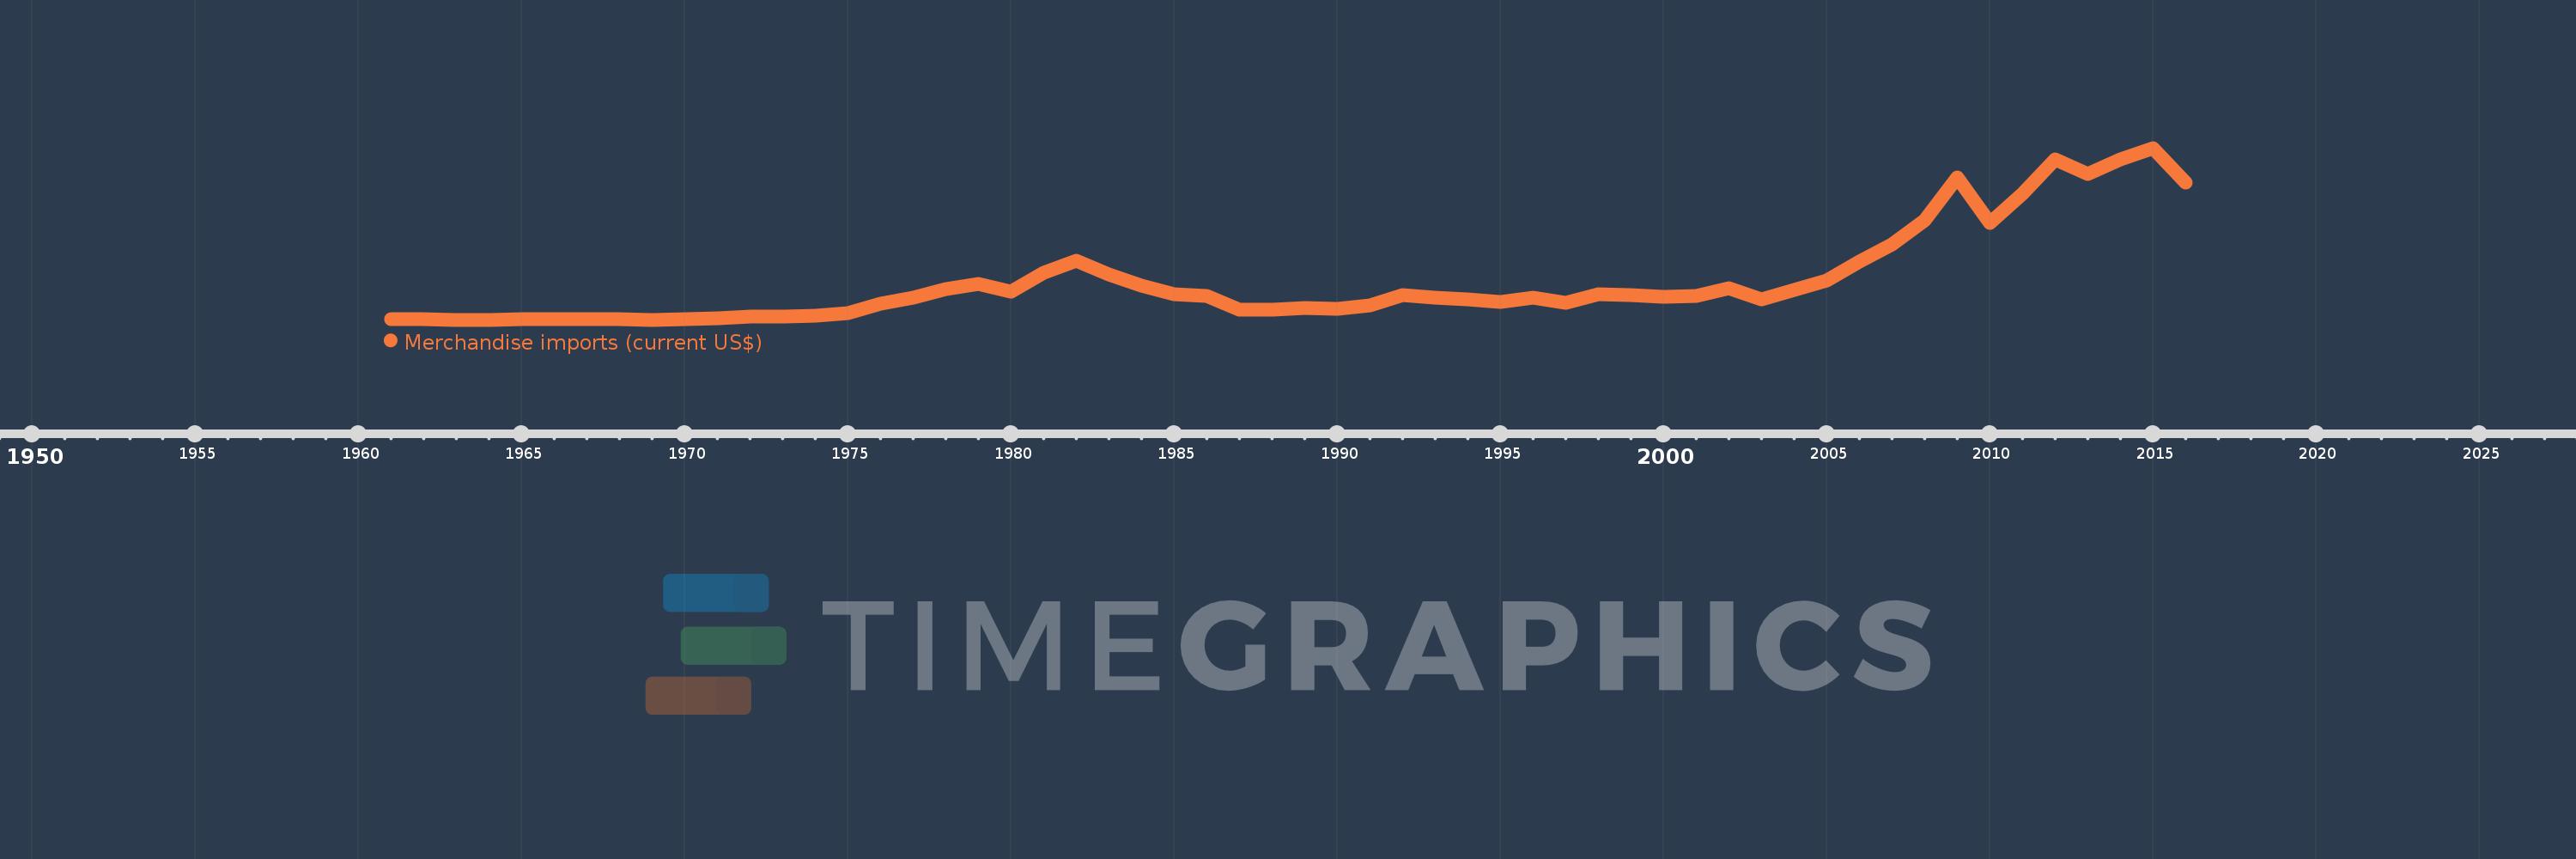
Merchandise imports (current US$)
2016,2015,2014,2013,2012,2011,2010,2009,2008,2007,2006,2005,2004,2003,2002,2001,2000,1999,1998,1997,1996,1995,1994,1993,1992,1991,1990,1989,1988,1987,1986,1985,1984,1983,1982,1981,1980,1979,1978,1977,1976,1975,1974,1973,1972,1971,1970,1969,1968,1967,1966,1965,1964,1963,1962,1961
This statistics in other country:
AfghanistanAlbaniaAlgeriaAmerican SamoaAngolaAntigua and BarbudaArab WorldArgentinaArmeniaArubaAustraliaAustriaAzerbaijanBahamas, TheBahrainBangladeshBarbadosBelarusBelgiumBelizeBeninBermudaBhutanBoliviaBosnia and HerzegovinaBotswanaBrazilBrunei DarussalamBulgariaBurkina FasoBurundiCabo VerdeCambodiaCameroonCanadaCaribbean small statesCentral African RepublicCentral Europe and the BalticsChadChileChinaColombiaComorosCongo, Dem. Rep.Congo, Rep.Costa RicaCote d'IvoireCroatiaCubaCuracaoCyprusCzech RepublicDenmarkDjiboutiDominicaDominican RepublicEarly-demographic dividendEast Asia & PacificEast Asia & Pacific (excluding high income)East Asia & Pacific (IDA & IBRD countries)EcuadorEgypt, Arab Rep.El SalvadorEquatorial GuineaEritreaEstoniaEthiopiaEuro areaEurope & Central AsiaEurope & Central Asia (excluding high income)Europe & Central Asia (IDA & IBRD countries)European UnionFaroe IslandsFijiFinlandFragile and conflict affected situationsFranceFrench PolynesiaGabonGambia, TheGeorgiaGermanyGhanaGreeceGreenlandGrenadaGuatemalaGuineaGuinea-BissauGuyanaHaitiHeavily indebted poor countries (HIPC)High incomeHondurasHong Kong SAR, ChinaHungaryIBRD onlyIcelandIDA & IBRD totalIDA blendIDA onlyIDA totalIndiaIndonesiaIran, Islamic Rep.IraqIrelandIsraelItalyJamaicaJapanJordanKazakhstanKenyaKiribatiKorea, Dem. People’s Rep.Korea, Rep.KuwaitKyrgyz RepublicLao PDRLate-demographic dividendLatin America & Caribbean Latin America & Caribbean (excluding high income)Latin America & the Caribbean (IDA & IBRD countries)LatviaLeast developed countries: UN classificationLebanonLesothoLiberiaLibyaLithuaniaLow & middle incomeLow incomeLower middle incomeLuxembourgMacao SAR, ChinaMacedonia, FYRMadagascarMalawiMalaysiaMaldivesMaliMaltaMarshall IslandsMauritaniaMauritiusMexicoMicronesia, Fed. Sts.Middle East & North AfricaMiddle East & North Africa (excluding high income)Middle East & North Africa (IDA & IBRD countries)Middle incomeMoldovaMongoliaMontenegroMoroccoMozambiqueMyanmarNamibiaNepalNetherlandsNew CaledoniaNew ZealandNicaraguaNigerNigeriaNorth AmericaNorthern Mariana IslandsNorwayOECD membersOmanOther small statesPacific island small statesPakistanPalauPanamaPapua New GuineaParaguayPeruPhilippinesPolandPortugalPost-demographic dividendPre-demographic dividendQatarRomaniaRussian FederationRwandaSamoaSao Tome and PrincipeSaudi ArabiaSenegalSerbiaSeychellesSierra LeoneSingaporeSint Maarten (Dutch part)Slovak RepublicSloveniaSmall statesSolomon IslandsSouth AfricaSouth AsiaSouth Asia (IDA & IBRD)SpainSri LankaSt. Kitts and NevisSt. LuciaSt. Martin (French part)St. Vincent and the GrenadinesSub-Saharan Africa Sub-Saharan Africa (excluding high income)Sub-Saharan Africa (IDA & IBRD countries)SudanSurinameSwazilandSwedenSwitzerlandSyrian Arab RepublicTajikistanTanzaniaThailandTimor-LesteTogoTongaTrinidad and TobagoTunisiaTurkeyTurkmenistanTuvaluUgandaUkraineUnited Arab EmiratesUnited KingdomUnited StatesUpper middle incomeUruguayUzbekistanVanuatuVenezuela, RBVietnamWorldYemen, Rep.ZambiaZimbabwe Timeline:
This timeline shows a graph from 1961 to 2016 of Nigeria. No data until 1960. Number of actual observations by date: 56.
Source name:
World Development Indicators
Source organization:
World Trade Organization.
Categories, topics:
Private Sector, Trade
Last updated:
apr 23, 2017
Indicators value changes by year
Minimum:
539.56 mln
jan 1, 1969
Maximum:
60.0 bln
jan 1, 2015
At the date of observation
Value
Absolute change
Change from previous value
jan 1, 1961
604.38 mln
+604.38 mln
0.0%
jan 1, 1962
622.86 mln
+18.48 mln
3.06%
jan 1, 1963
568.82 mln
-54.04 mln
-8.68%
jan 1, 1964
579.46 mln
+10.64 mln
1.87%
jan 1, 1965
710.92 mln
+131.46 mln
22.69%
jan 1, 1966
770.42 mln
+59.5 mln
8.37%
jan 1, 1967
717.78 mln
-52.64 mln
-6.83%
jan 1, 1968
625.94 mln
-91.84 mln
-12.8%
jan 1, 1969
539.56 mln
-86.38 mln
-13.8%
jan 1, 1970
696.22 mln
+156.66 mln
29.03%
jan 1, 1971
1.059 bln
+362.88 mln
52.12%
jan 1, 1972
1.514 bln
+454.74 mln
42.94%
jan 1, 1973
1.505 bln
-9.04 mln
-0.6%
jan 1, 1974
1.862 bln
+357.05 mln
23.73%
jan 1, 1975
2.772 bln
+910.26 mln
48.89%
jan 1, 1976
6.041 bln
+3.269 bln
117.93%
jan 1, 1977
8.213 bln
+2.172 bln
35.95%
jan 1, 1978
11.095 bln
+2.882 bln
35.09%
jan 1, 1979
12.821 bln
+1.726 bln
15.56%
jan 1, 1980
10.218 bln
-2.603 bln
-20.3%
jan 1, 1981
16.66 bln
+6.442 bln
63.04%
jan 1, 1982
20.877 bln
+4.217 bln
25.31%
jan 1, 1983
16.061 bln
-4.816 bln
-23.07%
jan 1, 1984
12.254 bln
-3.807 bln
-23.7%
jan 1, 1985
9.364 bln
-2.89 bln
-23.58%
jan 1, 1986
8.877 bln
-487.0 mln
-5.2%
jan 1, 1987
4.034 bln
-4.843 bln
-54.56%
jan 1, 1988
3.912 bln
-122.0 mln
-3.02%
jan 1, 1989
4.717 bln
+805.0 mln
20.58%
jan 1, 1990
4.187 bln
-530.0 mln
-11.24%
jan 1, 1991
5.627 bln
+1.44 bln
34.39%
jan 1, 1992
8.986 bln
+3.359 bln
59.69%
jan 1, 1993
8.275 bln
-711.0 mln
-7.91%
jan 1, 1994
7.508 bln
-767.0 mln
-9.27%
jan 1, 1995
6.613 bln
-895.0 mln
-11.92%
jan 1, 1996
8.222 bln
+1.609 bln
24.33%
jan 1, 1997
6.438 bln
-1.784 bln
-21.7%
jan 1, 1998
9.501 bln
+3.063 bln
47.58%
jan 1, 1999
9.211 bln
-290.0 mln
-3.05%
jan 1, 2000
8.588 bln
-623.0 mln
-6.76%
jan 1, 2001
8.721 bln
+133.0 mln
1.55%
jan 1, 2002
11.586 bln
+2.865 bln
32.85%
jan 1, 2003
7.547 bln
-4.039 bln
-34.86%
jan 1, 2004
10.853 bln
+3.306 bln
43.81%
jan 1, 2005
14.164 bln
+3.311 bln
30.51%
jan 1, 2006
20.754 bln
+6.59 bln
46.53%
jan 1, 2007
26.523 bln
+5.769 bln
27.79%
jan 1, 2008
34.83 bln
+8.308 bln
31.32%
jan 1, 2009
49.951 bln
+15.12 bln
43.41%
jan 1, 2010
33.906 bln
-16.044 bln
-32.12%
jan 1, 2011
44.235 bln
+10.329 bln
30.46%
jan 1, 2012
56.0 bln
+11.765 bln
26.6%
jan 1, 2013
51.0 bln
-5.0 bln
-8.93%
jan 1, 2014
56.0 bln
+5.0 bln
9.8%
jan 1, 2015
60.0 bln
+4.0 bln
7.14%
jan 1, 2016
48.0 bln
-12.0 bln
-20.0%
Ranking of countries by current statistics by years


Comments: