29
/
en
AIzaSyAYiBZKx7MnpbEhh9jyipgxe19OcubqV5w
April 1, 2024
113866
Cote d'Ivoire
CIV
true
2
1
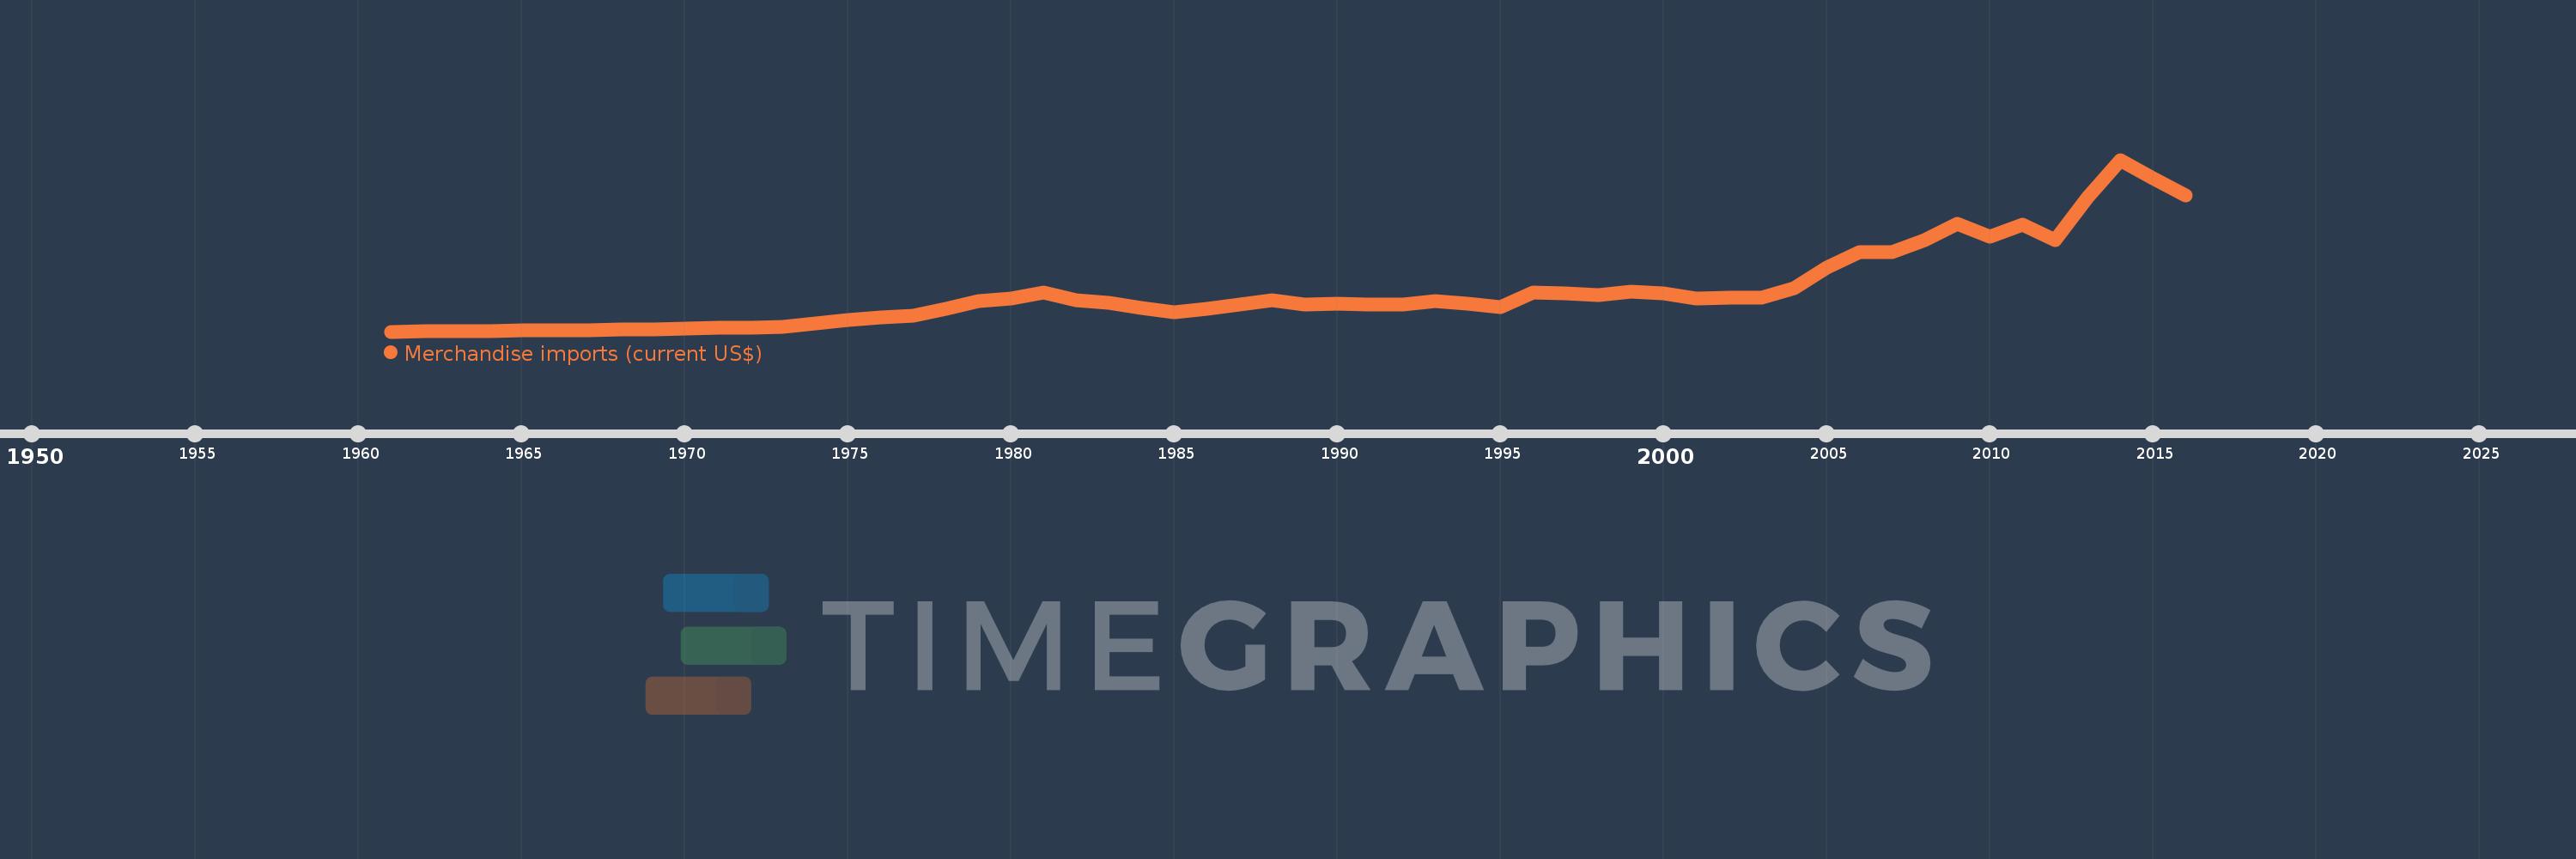
Merchandise imports (current US$)
2016,2015,2014,2013,2012,2011,2010,2009,2008,2007,2006,2005,2004,2003,2002,2001,2000,1999,1998,1997,1996,1995,1994,1993,1992,1991,1990,1989,1988,1987,1986,1985,1984,1983,1982,1981,1980,1979,1978,1977,1976,1975,1974,1973,1972,1971,1970,1969,1968,1967,1966,1965,1964,1963,1962,1961
This statistics in other country:
AfghanistanAlbaniaAlgeriaAmerican SamoaAngolaAntigua and BarbudaArab WorldArgentinaArmeniaArubaAustraliaAustriaAzerbaijanBahamas, TheBahrainBangladeshBarbadosBelarusBelgiumBelizeBeninBermudaBhutanBoliviaBosnia and HerzegovinaBotswanaBrazilBrunei DarussalamBulgariaBurkina FasoBurundiCabo VerdeCambodiaCameroonCanadaCaribbean small statesCentral African RepublicCentral Europe and the BalticsChadChileChinaColombiaComorosCongo, Dem. Rep.Congo, Rep.Costa RicaCote d'IvoireCroatiaCubaCuracaoCyprusCzech RepublicDenmarkDjiboutiDominicaDominican RepublicEarly-demographic dividendEast Asia & PacificEast Asia & Pacific (excluding high income)East Asia & Pacific (IDA & IBRD countries)EcuadorEgypt, Arab Rep.El SalvadorEquatorial GuineaEritreaEstoniaEthiopiaEuro areaEurope & Central AsiaEurope & Central Asia (excluding high income)Europe & Central Asia (IDA & IBRD countries)European UnionFaroe IslandsFijiFinlandFragile and conflict affected situationsFranceFrench PolynesiaGabonGambia, TheGeorgiaGermanyGhanaGreeceGreenlandGrenadaGuatemalaGuineaGuinea-BissauGuyanaHaitiHeavily indebted poor countries (HIPC)High incomeHondurasHong Kong SAR, ChinaHungaryIBRD onlyIcelandIDA & IBRD totalIDA blendIDA onlyIDA totalIndiaIndonesiaIran, Islamic Rep.IraqIrelandIsraelItalyJamaicaJapanJordanKazakhstanKenyaKiribatiKorea, Dem. People’s Rep.Korea, Rep.KuwaitKyrgyz RepublicLao PDRLate-demographic dividendLatin America & Caribbean Latin America & Caribbean (excluding high income)Latin America & the Caribbean (IDA & IBRD countries)LatviaLeast developed countries: UN classificationLebanonLesothoLiberiaLibyaLithuaniaLow & middle incomeLow incomeLower middle incomeLuxembourgMacao SAR, ChinaMacedonia, FYRMadagascarMalawiMalaysiaMaldivesMaliMaltaMarshall IslandsMauritaniaMauritiusMexicoMicronesia, Fed. Sts.Middle East & North AfricaMiddle East & North Africa (excluding high income)Middle East & North Africa (IDA & IBRD countries)Middle incomeMoldovaMongoliaMontenegroMoroccoMozambiqueMyanmarNamibiaNepalNetherlandsNew CaledoniaNew ZealandNicaraguaNigerNigeriaNorth AmericaNorthern Mariana IslandsNorwayOECD membersOmanOther small statesPacific island small statesPakistanPalauPanamaPapua New GuineaParaguayPeruPhilippinesPolandPortugalPost-demographic dividendPre-demographic dividendQatarRomaniaRussian FederationRwandaSamoaSao Tome and PrincipeSaudi ArabiaSenegalSerbiaSeychellesSierra LeoneSingaporeSint Maarten (Dutch part)Slovak RepublicSloveniaSmall statesSolomon IslandsSouth AfricaSouth AsiaSouth Asia (IDA & IBRD)SpainSri LankaSt. Kitts and NevisSt. LuciaSt. Martin (French part)St. Vincent and the GrenadinesSub-Saharan Africa Sub-Saharan Africa (excluding high income)Sub-Saharan Africa (IDA & IBRD countries)SudanSurinameSwazilandSwedenSwitzerlandSyrian Arab RepublicTajikistanTanzaniaThailandTimor-LesteTogoTongaTrinidad and TobagoTunisiaTurkeyTurkmenistanTuvaluUgandaUkraineUnited Arab EmiratesUnited KingdomUnited StatesUpper middle incomeUruguayUzbekistanVanuatuVenezuela, RBVietnamWorldYemen, Rep.ZambiaZimbabwe Timeline:
This timeline shows a graph from 1961 to 2016 of Cote d'Ivoire. No data until 1960. Number of actual observations by date: 56.
Source name:
World Development Indicators
Source organization:
World Trade Organization.
Categories, topics:
Private Sector, Trade
Last updated:
apr 23, 2017
Indicators value changes by year
Minimum:
131.09 mln
jan 1, 1961
Maximum:
12.483 bln
jan 1, 2014
At the date of observation
Value
Absolute change
Change from previous value
jan 1, 1961
131.09 mln
+131.09 mln
0.0%
jan 1, 1962
169.291 mln
+38.201 mln
29.14%
jan 1, 1963
156.085 mln
-13.206 mln
-7.8%
jan 1, 1964
169.777 mln
+13.692 mln
8.77%
jan 1, 1965
235.403 mln
+65.626 mln
38.65%
jan 1, 1966
236.335 mln
+932.0K
0.4%
jan 1, 1967
254.362 mln
+18.027 mln
7.63%
jan 1, 1968
263.517 mln
+9.155 mln
3.6%
jan 1, 1969
307.187 mln
+43.67 mln
16.57%
jan 1, 1970
333.428 mln
+26.241 mln
8.54%
jan 1, 1971
387.815 mln
+54.387 mln
16.31%
jan 1, 1972
400.368 mln
+12.553 mln
3.24%
jan 1, 1973
454.164 mln
+53.796 mln
13.44%
jan 1, 1974
709.979 mln
+255.815 mln
56.33%
jan 1, 1975
968.523 mln
+258.544 mln
36.42%
jan 1, 1976
1.127 bln
+158.517 mln
16.37%
jan 1, 1977
1.296 bln
+169.34 mln
15.03%
jan 1, 1978
1.756 bln
+459.82 mln
35.47%
jan 1, 1979
2.326 bln
+569.36 mln
32.42%
jan 1, 1980
2.491 bln
+165.93 mln
7.14%
jan 1, 1981
2.967 bln
+475.51 mln
19.09%
jan 1, 1982
2.382 bln
-585.0 mln
-19.72%
jan 1, 1983
2.18 bln
-202.0 mln
-8.48%
jan 1, 1984
1.839 bln
-341.0 mln
-15.64%
jan 1, 1985
1.496 bln
-343.0 mln
-18.65%
jan 1, 1986
1.749 bln
+253.0 mln
16.91%
jan 1, 1987
2.055 bln
+306.0 mln
17.5%
jan 1, 1988
2.37 bln
+315.0 mln
15.33%
jan 1, 1989
2.079 bln
-291.0 mln
-12.28%
jan 1, 1990
2.111 bln
+32.0 mln
1.54%
jan 1, 1991
2.097 bln
-14.0 mln
-0.66%
jan 1, 1992
2.103 bln
+6.0 mln
0.29%
jan 1, 1993
2.352 bln
+249.0 mln
11.84%
jan 1, 1994
2.115 bln
-237.0 mln
-10.08%
jan 1, 1995
1.917 bln
-198.0 mln
-9.36%
jan 1, 1996
2.931 bln
+1.014 bln
52.9%
jan 1, 1997
2.902 bln
-29.0 mln
-0.99%
jan 1, 1998
2.781 bln
-121.0 mln
-4.17%
jan 1, 1999
2.991 bln
+210.0 mln
7.55%
jan 1, 2000
2.898 bln
-93.355 mln
-3.12%
jan 1, 2001
2.482 bln
-415.454 mln
-14.34%
jan 1, 2002
2.548 bln
+65.673 mln
2.65%
jan 1, 2003
2.599 bln
+51.144 mln
2.01%
jan 1, 2004
3.279 bln
+679.993 mln
26.16%
jan 1, 2005
4.715 bln
+1.436 bln
43.79%
jan 1, 2006
5.865 bln
+1.15 bln
24.4%
jan 1, 2007
5.82 bln
-44.533 mln
-0.76%
jan 1, 2008
6.683 bln
+862.688 mln
14.82%
jan 1, 2009
7.884 bln
+1.201 bln
17.96%
jan 1, 2010
6.96 bln
-923.745 mln
-11.72%
jan 1, 2011
7.849 bln
+889.397 mln
12.78%
jan 1, 2012
6.72 bln
-1.129 bln
-14.39%
jan 1, 2013
9.77 bln
+3.05 bln
45.38%
jan 1, 2014
12.483 bln
+2.713 bln
27.77%
jan 1, 2015
11.178 bln
-1.305 bln
-10.46%
jan 1, 2016
9.915 bln
-1.262 bln
-11.29%
Ranking of countries by current statistics by years


Comments: