29
/
en
AIzaSyAYiBZKx7MnpbEhh9jyipgxe19OcubqV5w
April 1, 2024
149382
Haiti
HTI
true
2
1
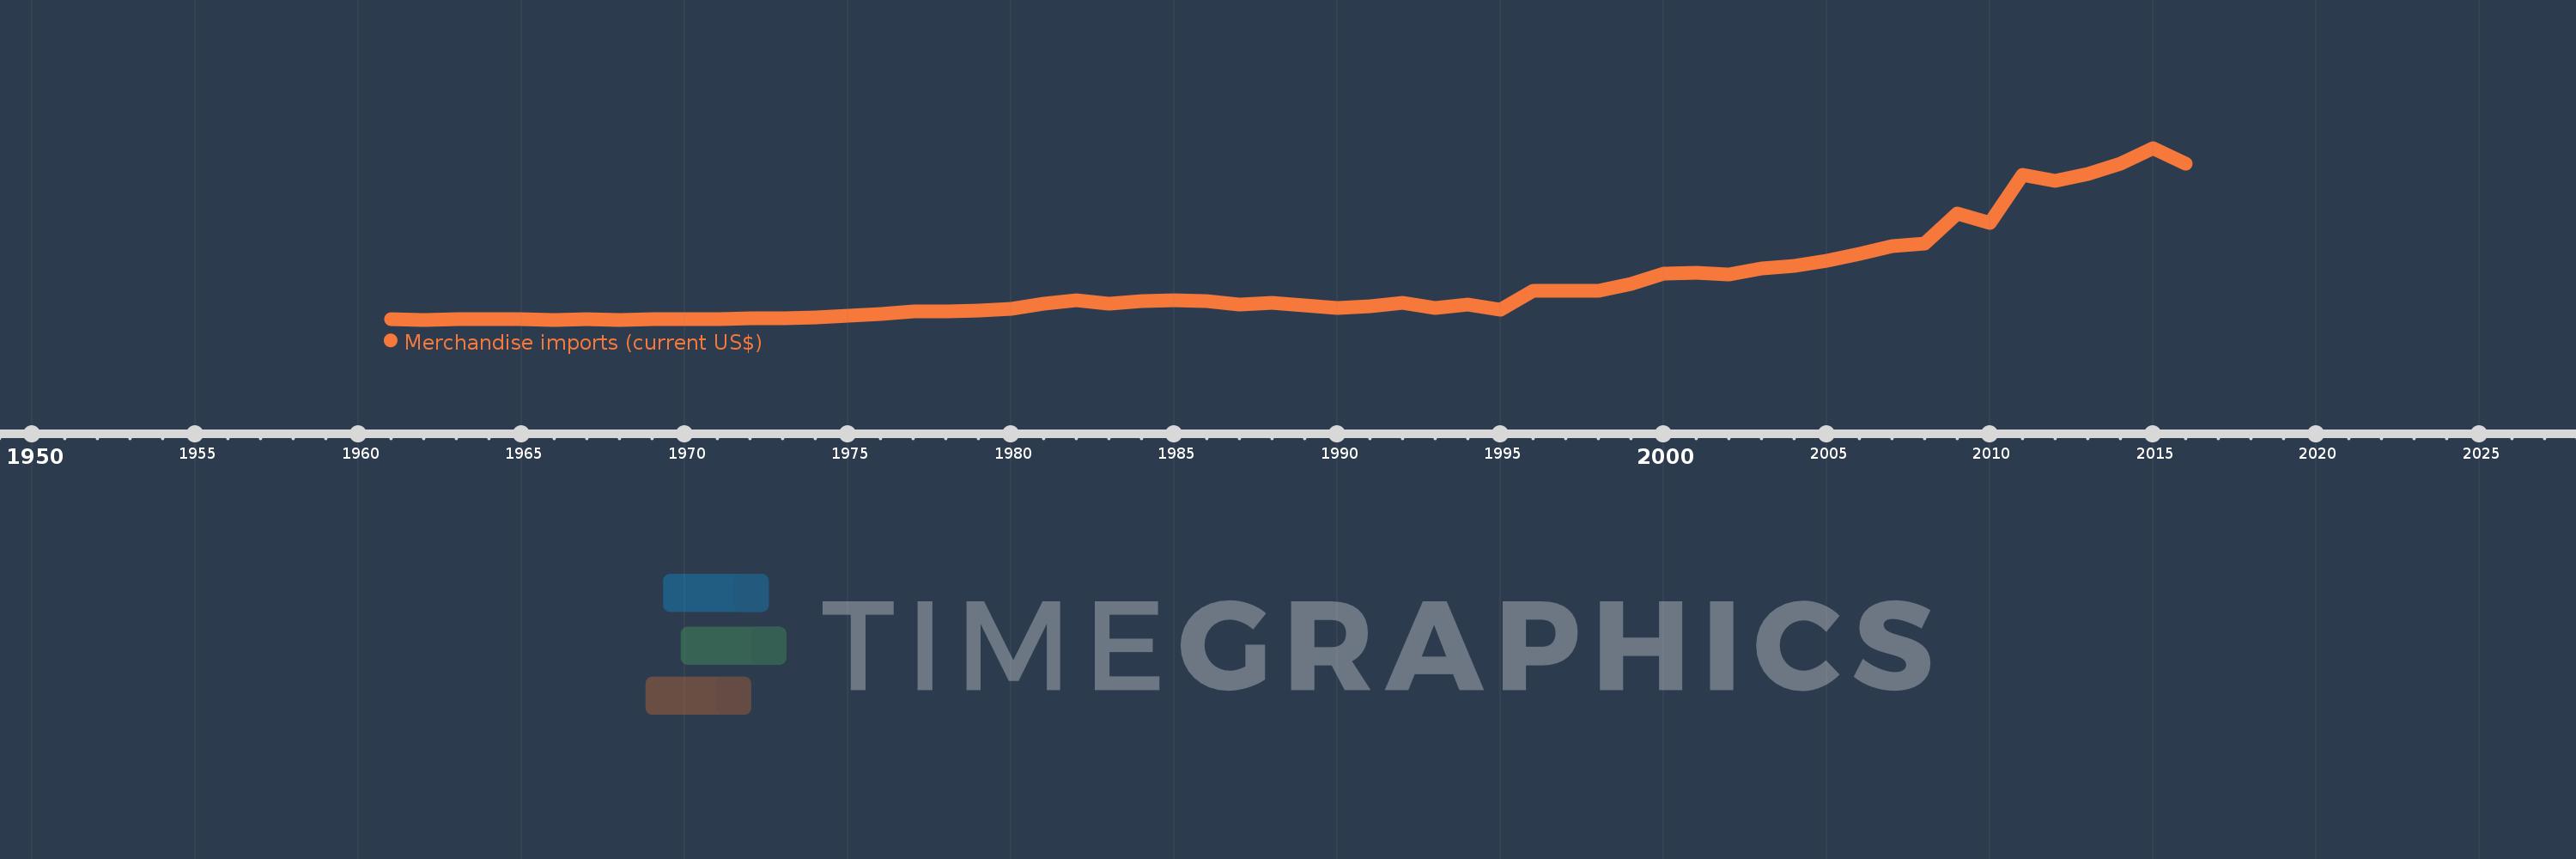
Merchandise imports (current US$)
2016,2015,2014,2013,2012,2011,2010,2009,2008,2007,2006,2005,2004,2003,2002,2001,2000,1999,1998,1997,1996,1995,1994,1993,1992,1991,1990,1989,1988,1987,1986,1985,1984,1983,1982,1981,1980,1979,1978,1977,1976,1975,1974,1973,1972,1971,1970,1969,1968,1967,1966,1965,1964,1963,1962,1961
This statistics in other country:
AfghanistanAlbaniaAlgeriaAmerican SamoaAngolaAntigua and BarbudaArab WorldArgentinaArmeniaArubaAustraliaAustriaAzerbaijanBahamas, TheBahrainBangladeshBarbadosBelarusBelgiumBelizeBeninBermudaBhutanBoliviaBosnia and HerzegovinaBotswanaBrazilBrunei DarussalamBulgariaBurkina FasoBurundiCabo VerdeCambodiaCameroonCanadaCaribbean small statesCentral African RepublicCentral Europe and the BalticsChadChileChinaColombiaComorosCongo, Dem. Rep.Congo, Rep.Costa RicaCote d'IvoireCroatiaCubaCuracaoCyprusCzech RepublicDenmarkDjiboutiDominicaDominican RepublicEarly-demographic dividendEast Asia & PacificEast Asia & Pacific (excluding high income)East Asia & Pacific (IDA & IBRD countries)EcuadorEgypt, Arab Rep.El SalvadorEquatorial GuineaEritreaEstoniaEthiopiaEuro areaEurope & Central AsiaEurope & Central Asia (excluding high income)Europe & Central Asia (IDA & IBRD countries)European UnionFaroe IslandsFijiFinlandFragile and conflict affected situationsFranceFrench PolynesiaGabonGambia, TheGeorgiaGermanyGhanaGreeceGreenlandGrenadaGuatemalaGuineaGuinea-BissauGuyanaHaitiHeavily indebted poor countries (HIPC)High incomeHondurasHong Kong SAR, ChinaHungaryIBRD onlyIcelandIDA & IBRD totalIDA blendIDA onlyIDA totalIndiaIndonesiaIran, Islamic Rep.IraqIrelandIsraelItalyJamaicaJapanJordanKazakhstanKenyaKiribatiKorea, Dem. People’s Rep.Korea, Rep.KuwaitKyrgyz RepublicLao PDRLate-demographic dividendLatin America & Caribbean Latin America & Caribbean (excluding high income)Latin America & the Caribbean (IDA & IBRD countries)LatviaLeast developed countries: UN classificationLebanonLesothoLiberiaLibyaLithuaniaLow & middle incomeLow incomeLower middle incomeLuxembourgMacao SAR, ChinaMacedonia, FYRMadagascarMalawiMalaysiaMaldivesMaliMaltaMarshall IslandsMauritaniaMauritiusMexicoMicronesia, Fed. Sts.Middle East & North AfricaMiddle East & North Africa (excluding high income)Middle East & North Africa (IDA & IBRD countries)Middle incomeMoldovaMongoliaMontenegroMoroccoMozambiqueMyanmarNamibiaNepalNetherlandsNew CaledoniaNew ZealandNicaraguaNigerNigeriaNorth AmericaNorthern Mariana IslandsNorwayOECD membersOmanOther small statesPacific island small statesPakistanPalauPanamaPapua New GuineaParaguayPeruPhilippinesPolandPortugalPost-demographic dividendPre-demographic dividendQatarRomaniaRussian FederationRwandaSamoaSao Tome and PrincipeSaudi ArabiaSenegalSerbiaSeychellesSierra LeoneSingaporeSint Maarten (Dutch part)Slovak RepublicSloveniaSmall statesSolomon IslandsSouth AfricaSouth AsiaSouth Asia (IDA & IBRD)SpainSri LankaSt. Kitts and NevisSt. LuciaSt. Martin (French part)St. Vincent and the GrenadinesSub-Saharan Africa Sub-Saharan Africa (excluding high income)Sub-Saharan Africa (IDA & IBRD countries)SudanSurinameSwazilandSwedenSwitzerlandSyrian Arab RepublicTajikistanTanzaniaThailandTimor-LesteTogoTongaTrinidad and TobagoTunisiaTurkeyTurkmenistanTuvaluUgandaUkraineUnited Arab EmiratesUnited KingdomUnited StatesUpper middle incomeUruguayUzbekistanVanuatuVenezuela, RBVietnamWorldYemen, Rep.ZambiaZimbabwe Timeline:
This timeline shows a graph from 1961 to 2016 of Haiti. No data until 1960. Number of actual observations by date: 56.
Source name:
World Development Indicators
Source organization:
World Trade Organization.
Categories, topics:
Private Sector, Trade
Last updated:
apr 23, 2017
Indicators value changes by year
Minimum:
32.874 mln
jan 1, 1962
Maximum:
3.733 bln
jan 1, 2015
At the date of observation
Value
Absolute change
Change from previous value
jan 1, 1961
40.398 mln
+40.398 mln
0.0%
jan 1, 1962
32.874 mln
-7.524 mln
-18.62%
jan 1, 1963
37.17 mln
+4.296 mln
13.07%
jan 1, 1964
38.874 mln
+1.704 mln
4.58%
jan 1, 1965
41.442 mln
+2.568 mln
6.61%
jan 1, 1966
33.612 mln
-7.83 mln
-18.89%
jan 1, 1967
37.624 mln
+4.012 mln
11.94%
jan 1, 1968
36.394 mln
-1.23 mln
-3.27%
jan 1, 1969
37.576 mln
+1.182 mln
3.25%
jan 1, 1970
38.81 mln
+1.234 mln
3.28%
jan 1, 1971
55.0 mln
+16.19 mln
41.72%
jan 1, 1972
60.43 mln
+5.43 mln
9.87%
jan 1, 1973
68.904 mln
+8.474 mln
14.02%
jan 1, 1974
83.176 mln
+14.272 mln
20.71%
jan 1, 1975
125.23 mln
+42.054 mln
50.56%
jan 1, 1976
148.938 mln
+23.708 mln
18.93%
jan 1, 1977
206.694 mln
+57.756 mln
38.78%
jan 1, 1978
212.65 mln
+5.956 mln
2.88%
jan 1, 1979
233.234 mln
+20.584 mln
9.68%
jan 1, 1980
272.07 mln
+38.836 mln
16.65%
jan 1, 1981
375.0 mln
+102.93 mln
37.83%
jan 1, 1982
461.0 mln
+86.0 mln
22.93%
jan 1, 1983
387.0 mln
-74.0 mln
-16.05%
jan 1, 1984
441.0 mln
+54.0 mln
13.95%
jan 1, 1985
450.0 mln
+9.0 mln
2.04%
jan 1, 1986
442.0 mln
-8.0 mln
-1.78%
jan 1, 1987
360.0 mln
-82.0 mln
-18.55%
jan 1, 1988
399.0 mln
+39.0 mln
10.83%
jan 1, 1989
344.0 mln
-55.0 mln
-13.78%
jan 1, 1990
291.0 mln
-53.0 mln
-15.41%
jan 1, 1991
332.0 mln
+41.0 mln
14.09%
jan 1, 1992
400.0 mln
+68.0 mln
20.48%
jan 1, 1993
278.0 mln
-122.0 mln
-30.5%
jan 1, 1994
355.0 mln
+77.0 mln
27.7%
jan 1, 1995
251.0 mln
-104.0 mln
-29.3%
jan 1, 1996
653.0 mln
+402.0 mln
160.16%
jan 1, 1997
665.0 mln
+12.0 mln
1.84%
jan 1, 1998
648.0 mln
-17.0 mln
-2.56%
jan 1, 1999
797.0 mln
+149.0 mln
22.99%
jan 1, 2000
1.025 bln
+228.0 mln
28.61%
jan 1, 2001
1.036 bln
+11.0 mln
1.07%
jan 1, 2002
1.013 bln
-23.0 mln
-2.22%
jan 1, 2003
1.13 bln
+117.0 mln
11.55%
jan 1, 2004
1.188 bln
+57.81 mln
5.12%
jan 1, 2005
1.306 bln
+118.19 mln
9.95%
jan 1, 2006
1.454 bln
+147.74 mln
11.31%
jan 1, 2007
1.619 bln
+165.29 mln
11.37%
jan 1, 2008
1.682 bln
+62.48 mln
3.86%
jan 1, 2009
2.315 bln
+633.97 mln
37.7%
jan 1, 2010
2.124 bln
-191.63 mln
-8.28%
jan 1, 2011
3.146 bln
+1.022 bln
48.13%
jan 1, 2012
3.02 bln
-126.55 mln
-4.02%
jan 1, 2013
3.17 bln
+149.99 mln
4.97%
jan 1, 2014
3.403 bln
+233.44 mln
7.37%
jan 1, 2015
3.733 bln
+330.0 mln
9.7%
jan 1, 2016
3.4 bln
-332.98 mln
-8.92%
Ranking of countries by current statistics by years


Comments: