29
/
en
AIzaSyAYiBZKx7MnpbEhh9jyipgxe19OcubqV5w
April 1, 2024
86206
Bhutan
BTN
true
2
1
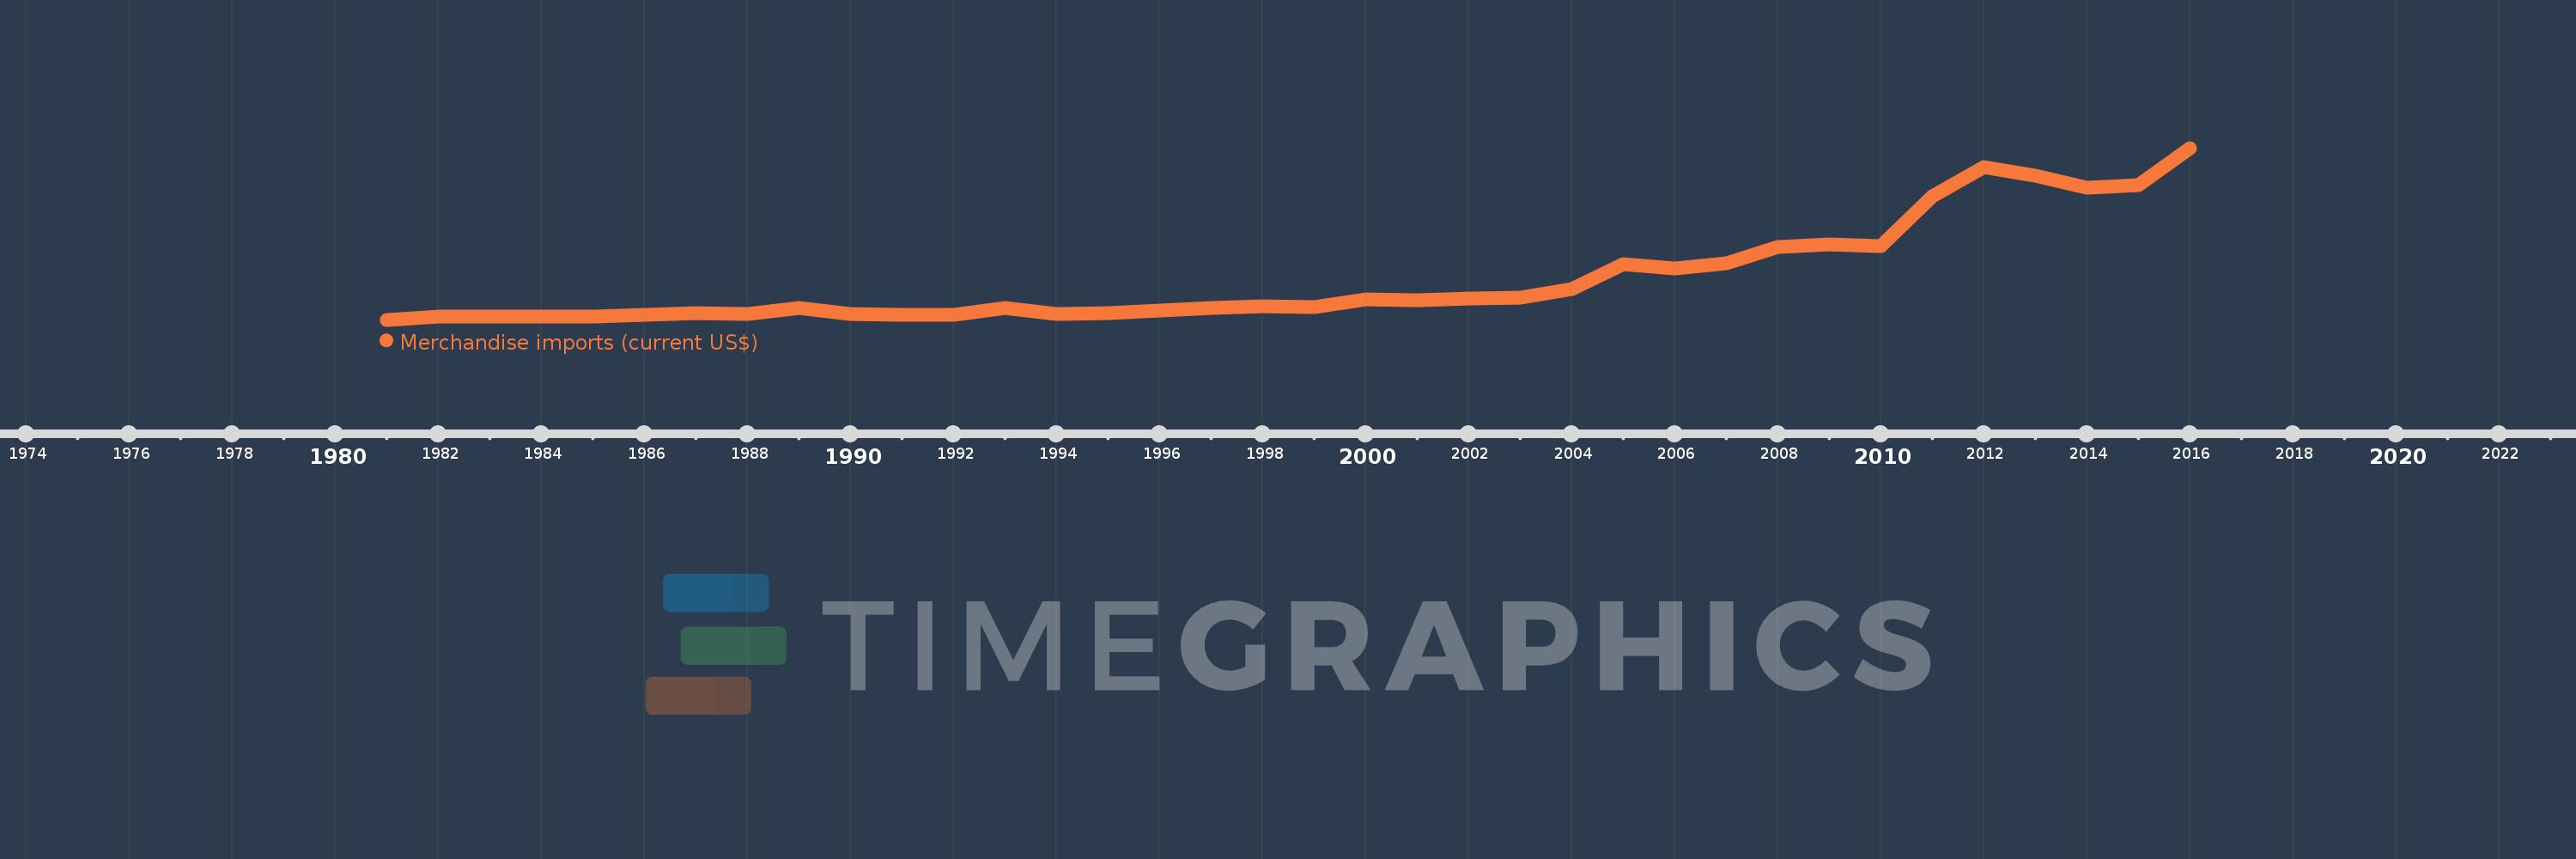
Merchandise imports (current US$)
2016,2015,2014,2013,2012,2011,2010,2009,2008,2007,2006,2005,2004,2003,2002,2001,2000,1999,1998,1997,1996,1995,1994,1993,1992,1991,1990,1989,1988,1987,1986,1985,1984,1983,1982,1981
This statistics in other country:
AfghanistanAlbaniaAlgeriaAmerican SamoaAngolaAntigua and BarbudaArab WorldArgentinaArmeniaArubaAustraliaAustriaAzerbaijanBahamas, TheBahrainBangladeshBarbadosBelarusBelgiumBelizeBeninBermudaBhutanBoliviaBosnia and HerzegovinaBotswanaBrazilBrunei DarussalamBulgariaBurkina FasoBurundiCabo VerdeCambodiaCameroonCanadaCaribbean small statesCentral African RepublicCentral Europe and the BalticsChadChileChinaColombiaComorosCongo, Dem. Rep.Congo, Rep.Costa RicaCote d'IvoireCroatiaCubaCuracaoCyprusCzech RepublicDenmarkDjiboutiDominicaDominican RepublicEarly-demographic dividendEast Asia & PacificEast Asia & Pacific (excluding high income)East Asia & Pacific (IDA & IBRD countries)EcuadorEgypt, Arab Rep.El SalvadorEquatorial GuineaEritreaEstoniaEthiopiaEuro areaEurope & Central AsiaEurope & Central Asia (excluding high income)Europe & Central Asia (IDA & IBRD countries)European UnionFaroe IslandsFijiFinlandFragile and conflict affected situationsFranceFrench PolynesiaGabonGambia, TheGeorgiaGermanyGhanaGreeceGreenlandGrenadaGuatemalaGuineaGuinea-BissauGuyanaHaitiHeavily indebted poor countries (HIPC)High incomeHondurasHong Kong SAR, ChinaHungaryIBRD onlyIcelandIDA & IBRD totalIDA blendIDA onlyIDA totalIndiaIndonesiaIran, Islamic Rep.IraqIrelandIsraelItalyJamaicaJapanJordanKazakhstanKenyaKiribatiKorea, Dem. People’s Rep.Korea, Rep.KuwaitKyrgyz RepublicLao PDRLate-demographic dividendLatin America & Caribbean Latin America & Caribbean (excluding high income)Latin America & the Caribbean (IDA & IBRD countries)LatviaLeast developed countries: UN classificationLebanonLesothoLiberiaLibyaLithuaniaLow & middle incomeLow incomeLower middle incomeLuxembourgMacao SAR, ChinaMacedonia, FYRMadagascarMalawiMalaysiaMaldivesMaliMaltaMarshall IslandsMauritaniaMauritiusMexicoMicronesia, Fed. Sts.Middle East & North AfricaMiddle East & North Africa (excluding high income)Middle East & North Africa (IDA & IBRD countries)Middle incomeMoldovaMongoliaMontenegroMoroccoMozambiqueMyanmarNamibiaNepalNetherlandsNew CaledoniaNew ZealandNicaraguaNigerNigeriaNorth AmericaNorthern Mariana IslandsNorwayOECD membersOmanOther small statesPacific island small statesPakistanPalauPanamaPapua New GuineaParaguayPeruPhilippinesPolandPortugalPost-demographic dividendPre-demographic dividendQatarRomaniaRussian FederationRwandaSamoaSao Tome and PrincipeSaudi ArabiaSenegalSerbiaSeychellesSierra LeoneSingaporeSint Maarten (Dutch part)Slovak RepublicSloveniaSmall statesSolomon IslandsSouth AfricaSouth AsiaSouth Asia (IDA & IBRD)SpainSri LankaSt. Kitts and NevisSt. LuciaSt. Martin (French part)St. Vincent and the GrenadinesSub-Saharan Africa Sub-Saharan Africa (excluding high income)Sub-Saharan Africa (IDA & IBRD countries)SudanSurinameSwazilandSwedenSwitzerlandSyrian Arab RepublicTajikistanTanzaniaThailandTimor-LesteTogoTongaTrinidad and TobagoTunisiaTurkeyTurkmenistanTuvaluUgandaUkraineUnited Arab EmiratesUnited KingdomUnited StatesUpper middle incomeUruguayUzbekistanVanuatuVenezuela, RBVietnamWorldYemen, Rep.ZambiaZimbabwe Timeline:
This timeline shows a graph from 1981 to 2016 of Bhutan. No data until 1980. Number of actual observations by date: 36.
Source name:
World Development Indicators
Source organization:
World Trade Organization.
Categories, topics:
Private Sector, Trade
Last updated:
apr 23, 2017
Indicators value changes by year
Minimum:
50.0 mln
jan 1, 1981
Maximum:
1.17 bln
jan 1, 2016
At the date of observation
Value
Absolute change
Change from previous value
jan 1, 1981
50.0 mln
+50.0 mln
0.0%
jan 1, 1982
68.0 mln
+18.0 mln
36.0%
jan 1, 1983
68.0 mln
0.0
0.0%
jan 1, 1984
72.0 mln
+4.0 mln
5.88%
jan 1, 1985
73.0 mln
+1000.0K
1.39%
jan 1, 1986
84.0 mln
+11.0 mln
15.07%
jan 1, 1987
93.0 mln
+9.0 mln
10.71%
jan 1, 1988
87.0 mln
-6.0 mln
-6.45%
jan 1, 1989
127.0 mln
+40.0 mln
45.98%
jan 1, 1990
90.0 mln
-37.0 mln
-29.13%
jan 1, 1991
81.0 mln
-9.0 mln
-10.0%
jan 1, 1992
83.0 mln
+2.0 mln
2.47%
jan 1, 1993
125.0 mln
+42.0 mln
50.6%
jan 1, 1994
90.0 mln
-35.0 mln
-28.0%
jan 1, 1995
92.0 mln
+2.0 mln
2.22%
jan 1, 1996
112.0 mln
+20.0 mln
21.74%
jan 1, 1997
128.0 mln
+16.0 mln
14.29%
jan 1, 1998
137.0 mln
+9.0 mln
7.03%
jan 1, 1999
134.0 mln
-3.0 mln
-2.19%
jan 1, 2000
182.0 mln
+48.0 mln
35.82%
jan 1, 2001
175.2 mln
-6.8 mln
-3.74%
jan 1, 2002
191.0 mln
+15.8 mln
9.02%
jan 1, 2003
196.541 mln
+5.541 mln
2.9%
jan 1, 2004
248.984 mln
+52.443 mln
26.68%
jan 1, 2005
411.0 mln
+162.016 mln
65.07%
jan 1, 2006
386.292 mln
-24.708 mln
-6.01%
jan 1, 2007
419.626 mln
+33.334 mln
8.63%
jan 1, 2008
525.906 mln
+106.28 mln
25.33%
jan 1, 2009
543.271 mln
+17.365 mln
3.3%
jan 1, 2010
529.408 mln
-13.863 mln
-2.55%
jan 1, 2011
853.804 mln
+324.396 mln
61.28%
jan 1, 2012
1.043 bln
+189.631 mln
22.21%
jan 1, 2013
991.398 mln
-52.037 mln
-4.99%
jan 1, 2014
909.13 mln
-82.268 mln
-8.3%
jan 1, 2015
926.855 mln
+17.725 mln
1.95%
jan 1, 2016
1.17 bln
+243.145 mln
26.23%
Ranking of countries by current statistics by years


Comments: