29
/
en
AIzaSyAYiBZKx7MnpbEhh9jyipgxe19OcubqV5w
April 1, 2024
160738
Israel
ISR
true
2
1
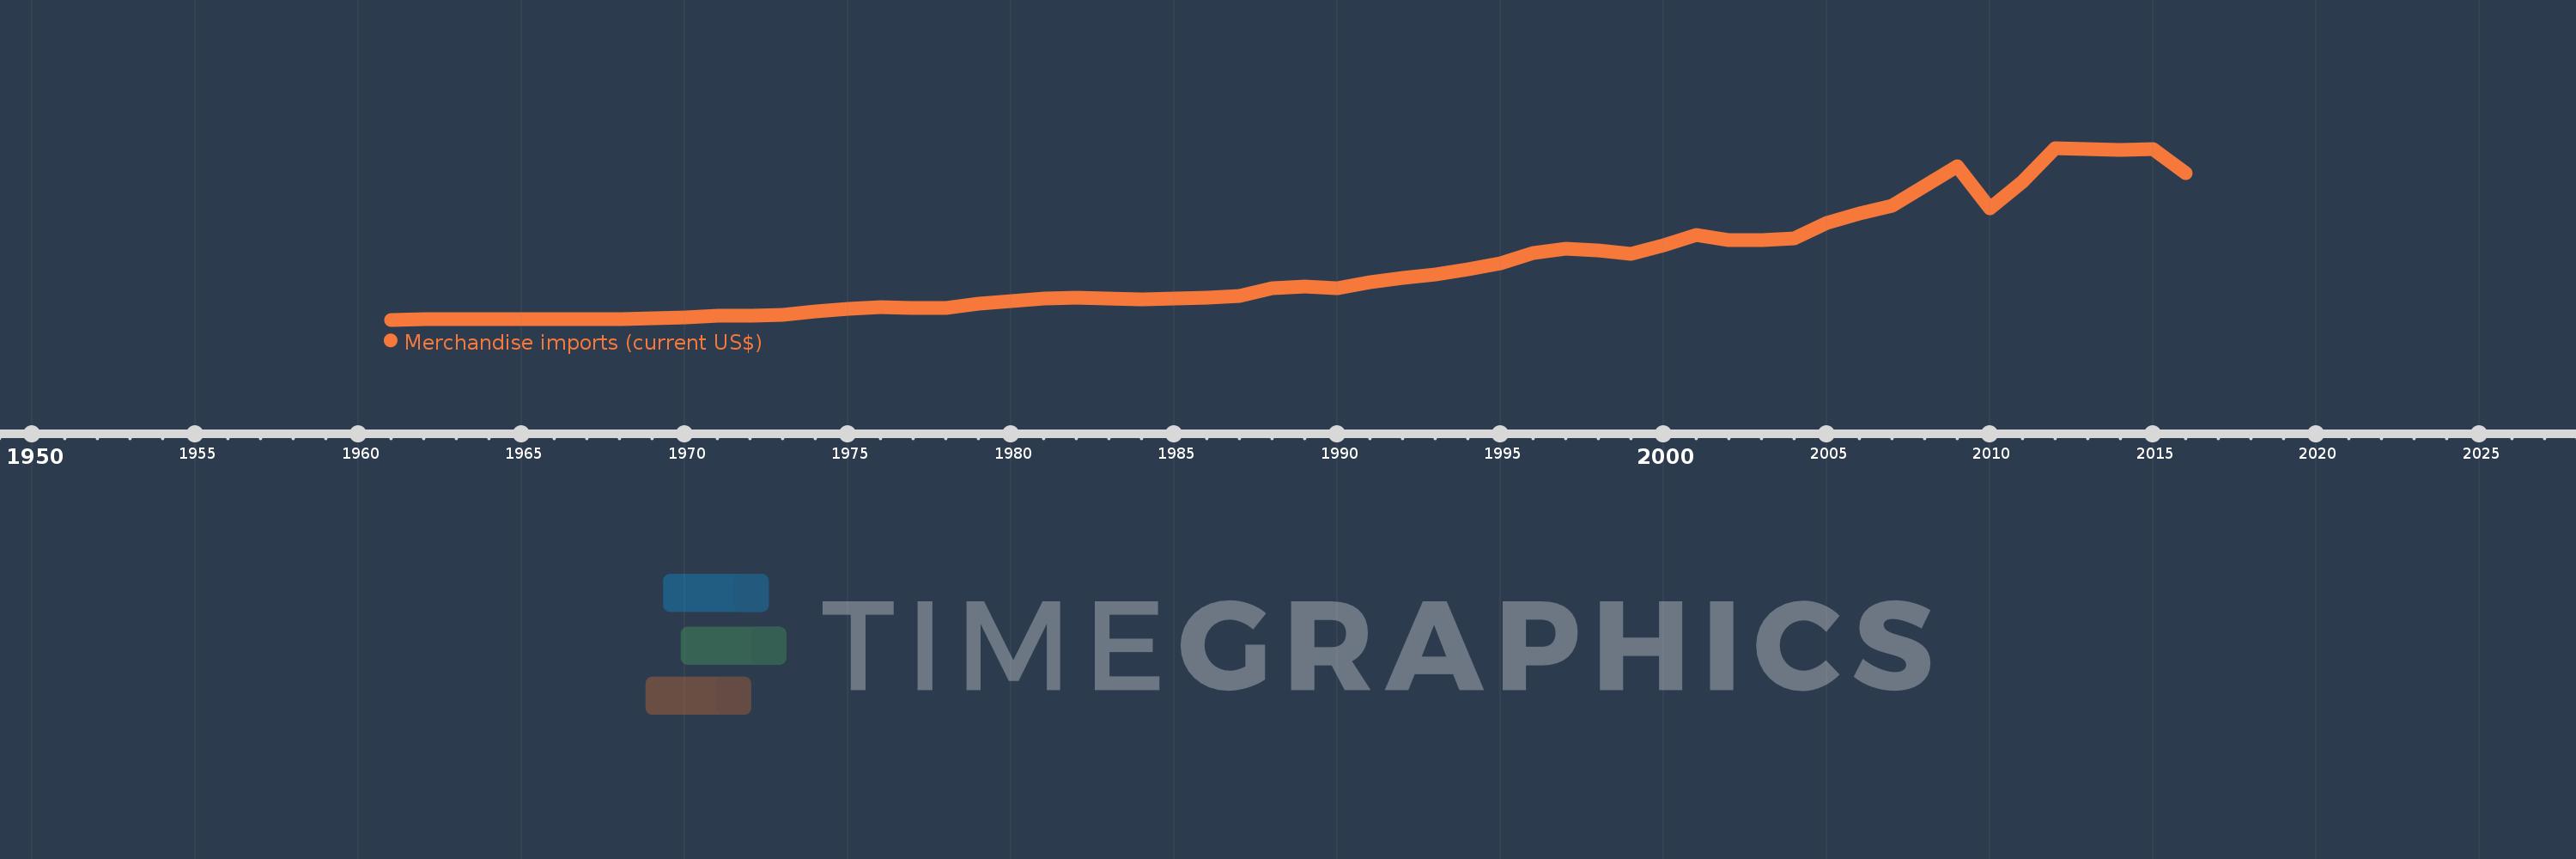
Merchandise imports (current US$)
2016,2015,2014,2013,2012,2011,2010,2009,2008,2007,2006,2005,2004,2003,2002,2001,2000,1999,1998,1997,1996,1995,1994,1993,1992,1991,1990,1989,1988,1987,1986,1985,1984,1983,1982,1981,1980,1979,1978,1977,1976,1975,1974,1973,1972,1971,1970,1969,1968,1967,1966,1965,1964,1963,1962,1961
This statistics in other country:
AfghanistanAlbaniaAlgeriaAmerican SamoaAngolaAntigua and BarbudaArab WorldArgentinaArmeniaArubaAustraliaAustriaAzerbaijanBahamas, TheBahrainBangladeshBarbadosBelarusBelgiumBelizeBeninBermudaBhutanBoliviaBosnia and HerzegovinaBotswanaBrazilBrunei DarussalamBulgariaBurkina FasoBurundiCabo VerdeCambodiaCameroonCanadaCaribbean small statesCentral African RepublicCentral Europe and the BalticsChadChileChinaColombiaComorosCongo, Dem. Rep.Congo, Rep.Costa RicaCote d'IvoireCroatiaCubaCuracaoCyprusCzech RepublicDenmarkDjiboutiDominicaDominican RepublicEarly-demographic dividendEast Asia & PacificEast Asia & Pacific (excluding high income)East Asia & Pacific (IDA & IBRD countries)EcuadorEgypt, Arab Rep.El SalvadorEquatorial GuineaEritreaEstoniaEthiopiaEuro areaEurope & Central AsiaEurope & Central Asia (excluding high income)Europe & Central Asia (IDA & IBRD countries)European UnionFaroe IslandsFijiFinlandFragile and conflict affected situationsFranceFrench PolynesiaGabonGambia, TheGeorgiaGermanyGhanaGreeceGreenlandGrenadaGuatemalaGuineaGuinea-BissauGuyanaHaitiHeavily indebted poor countries (HIPC)High incomeHondurasHong Kong SAR, ChinaHungaryIBRD onlyIcelandIDA & IBRD totalIDA blendIDA onlyIDA totalIndiaIndonesiaIran, Islamic Rep.IraqIrelandIsraelItalyJamaicaJapanJordanKazakhstanKenyaKiribatiKorea, Dem. People’s Rep.Korea, Rep.KuwaitKyrgyz RepublicLao PDRLate-demographic dividendLatin America & Caribbean Latin America & Caribbean (excluding high income)Latin America & the Caribbean (IDA & IBRD countries)LatviaLeast developed countries: UN classificationLebanonLesothoLiberiaLibyaLithuaniaLow & middle incomeLow incomeLower middle incomeLuxembourgMacao SAR, ChinaMacedonia, FYRMadagascarMalawiMalaysiaMaldivesMaliMaltaMarshall IslandsMauritaniaMauritiusMexicoMicronesia, Fed. Sts.Middle East & North AfricaMiddle East & North Africa (excluding high income)Middle East & North Africa (IDA & IBRD countries)Middle incomeMoldovaMongoliaMontenegroMoroccoMozambiqueMyanmarNamibiaNepalNetherlandsNew CaledoniaNew ZealandNicaraguaNigerNigeriaNorth AmericaNorthern Mariana IslandsNorwayOECD membersOmanOther small statesPacific island small statesPakistanPalauPanamaPapua New GuineaParaguayPeruPhilippinesPolandPortugalPost-demographic dividendPre-demographic dividendQatarRomaniaRussian FederationRwandaSamoaSao Tome and PrincipeSaudi ArabiaSenegalSerbiaSeychellesSierra LeoneSingaporeSint Maarten (Dutch part)Slovak RepublicSloveniaSmall statesSolomon IslandsSouth AfricaSouth AsiaSouth Asia (IDA & IBRD)SpainSri LankaSt. Kitts and NevisSt. LuciaSt. Martin (French part)St. Vincent and the GrenadinesSub-Saharan Africa Sub-Saharan Africa (excluding high income)Sub-Saharan Africa (IDA & IBRD countries)SudanSurinameSwazilandSwedenSwitzerlandSyrian Arab RepublicTajikistanTanzaniaThailandTimor-LesteTogoTongaTrinidad and TobagoTunisiaTurkeyTurkmenistanTuvaluUgandaUkraineUnited Arab EmiratesUnited KingdomUnited StatesUpper middle incomeUruguayUzbekistanVanuatuVenezuela, RBVietnamWorldYemen, Rep.ZambiaZimbabwe Timeline:
This timeline shows a graph from 1961 to 2016 of Israel. No data until 1960. Number of actual observations by date: 56.
Source name:
World Development Indicators
Source organization:
World Trade Organization.
Categories, topics:
Private Sector, Trade
Last updated:
apr 23, 2017
Indicators value changes by year
Minimum:
496.2 mln
jan 1, 1961
Maximum:
75.83 bln
jan 1, 2012
At the date of observation
Value
Absolute change
Change from previous value
jan 1, 1961
496.2 mln
+496.2 mln
0.0%
jan 1, 1962
580.4 mln
+84.2 mln
16.97%
jan 1, 1963
635.1 mln
+54.7 mln
9.42%
jan 1, 1964
673.6 mln
+38.5 mln
6.06%
jan 1, 1965
839.3 mln
+165.7 mln
24.6%
jan 1, 1966
837.5 mln
-1.8 mln
-0.21%
jan 1, 1967
832.6 mln
-4.9 mln
-0.59%
jan 1, 1968
773.8 mln
-58.8 mln
-7.06%
jan 1, 1969
1.307 bln
+533.5 mln
68.95%
jan 1, 1970
1.653 bln
+345.4 mln
26.42%
jan 1, 1971
2.079 bln
+426.7 mln
25.82%
jan 1, 1972
2.363 bln
+283.9 mln
13.65%
jan 1, 1973
2.473 bln
+109.9 mln
4.65%
jan 1, 1974
4.24 bln
+1.767 bln
71.45%
jan 1, 1975
5.437 bln
+1.197 bln
28.23%
jan 1, 1976
5.997 bln
+560.2 mln
10.3%
jan 1, 1977
5.669 bln
-328.1 mln
-5.47%
jan 1, 1978
5.787 bln
+117.9 mln
2.08%
jan 1, 1979
7.415 bln
+1.627 bln
28.12%
jan 1, 1980
8.576 bln
+1.162 bln
15.67%
jan 1, 1981
9.784 bln
+1.208 bln
14.08%
jan 1, 1982
10.235 bln
+451.0 mln
4.61%
jan 1, 1983
9.655 bln
-580.0 mln
-5.67%
jan 1, 1984
9.574 bln
-81.0 mln
-0.84%
jan 1, 1985
9.819 bln
+245.0 mln
2.56%
jan 1, 1986
10.173 bln
+354.0 mln
3.61%
jan 1, 1987
10.806 bln
+633.0 mln
6.22%
jan 1, 1988
14.348 bln
+3.542 bln
32.78%
jan 1, 1989
15.018 bln
+670.0 mln
4.67%
jan 1, 1990
14.347 bln
-671.0 mln
-4.47%
jan 1, 1991
16.793 bln
+2.446 bln
17.05%
jan 1, 1992
18.848 bln
+2.055 bln
12.24%
jan 1, 1993
20.261 bln
+1.413 bln
7.5%
jan 1, 1994
22.623 bln
+2.362 bln
11.66%
jan 1, 1995
25.237 bln
+2.614 bln
11.55%
jan 1, 1996
29.578 bln
+4.341 bln
17.2%
jan 1, 1997
31.62 bln
+2.042 bln
6.9%
jan 1, 1998
30.781 bln
-839.0 mln
-2.65%
jan 1, 1999
29.342 bln
-1.439 bln
-4.67%
jan 1, 2000
33.166 bln
+3.824 bln
13.03%
jan 1, 2001
37.686 bln
+4.52 bln
13.63%
jan 1, 2002
35.449 bln
-2.237 bln
-5.94%
jan 1, 2003
35.517 bln
+68.0 mln
0.19%
jan 1, 2004
36.303 bln
+785.8 mln
2.21%
jan 1, 2005
42.864 bln
+6.561 bln
18.07%
jan 1, 2006
47.142 bln
+4.278 bln
9.98%
jan 1, 2007
50.334 bln
+3.192 bln
6.77%
jan 1, 2008
59.039 bln
+8.705 bln
17.29%
jan 1, 2009
67.656 bln
+8.617 bln
14.6%
jan 1, 2010
49.278 bln
-18.378 bln
-27.16%
jan 1, 2011
61.209 bln
+11.931 bln
24.21%
jan 1, 2012
75.83 bln
+14.621 bln
23.89%
jan 1, 2013
75.392 bln
-438.1 mln
-0.58%
jan 1, 2014
74.861 bln
-530.6 mln
-0.7%
jan 1, 2015
75.483 bln
+621.9 mln
0.83%
jan 1, 2016
64.813 bln
-10.67 bln
-14.14%
Ranking of countries by current statistics by years


Comments: