29
/
en
AIzaSyAYiBZKx7MnpbEhh9jyipgxe19OcubqV5w
April 1, 2024
145936
Guinea
GIN
true
2
1
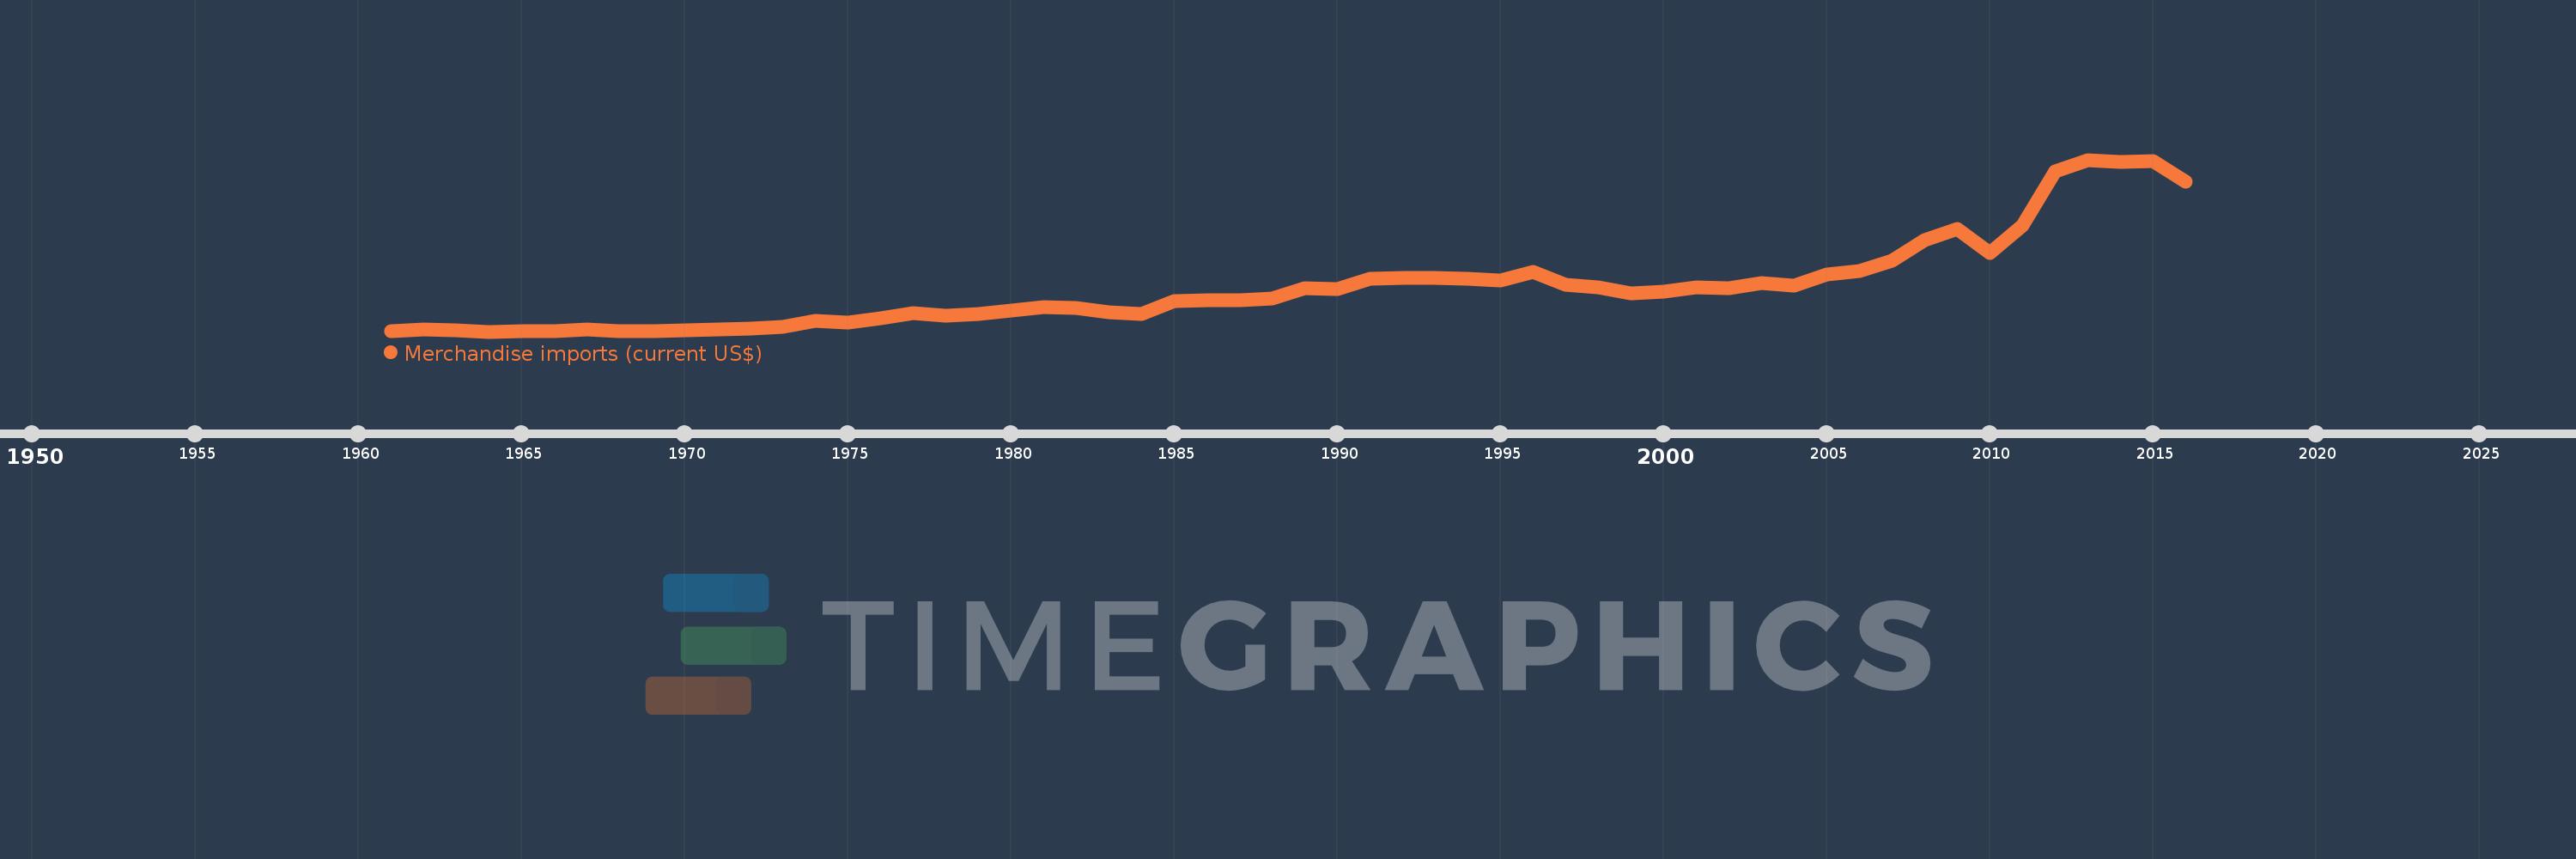
Merchandise imports (current US$)
2016,2015,2014,2013,2012,2011,2010,2009,2008,2007,2006,2005,2004,2003,2002,2001,2000,1999,1998,1997,1996,1995,1994,1993,1992,1991,1990,1989,1988,1987,1986,1985,1984,1983,1982,1981,1979,1978,1977,1976,1975,1974,1973,1972,1971,1970,1969,1968,1967,1966,1965,1964,1963,1962,1961
This statistics in other country:
AfghanistanAlbaniaAlgeriaAmerican SamoaAngolaAntigua and BarbudaArab WorldArgentinaArmeniaArubaAustraliaAustriaAzerbaijanBahamas, TheBahrainBangladeshBarbadosBelarusBelgiumBelizeBeninBermudaBhutanBoliviaBosnia and HerzegovinaBotswanaBrazilBrunei DarussalamBulgariaBurkina FasoBurundiCabo VerdeCambodiaCameroonCanadaCaribbean small statesCentral African RepublicCentral Europe and the BalticsChadChileChinaColombiaComorosCongo, Dem. Rep.Congo, Rep.Costa RicaCote d'IvoireCroatiaCubaCuracaoCyprusCzech RepublicDenmarkDjiboutiDominicaDominican RepublicEarly-demographic dividendEast Asia & PacificEast Asia & Pacific (excluding high income)East Asia & Pacific (IDA & IBRD countries)EcuadorEgypt, Arab Rep.El SalvadorEquatorial GuineaEritreaEstoniaEthiopiaEuro areaEurope & Central AsiaEurope & Central Asia (excluding high income)Europe & Central Asia (IDA & IBRD countries)European UnionFaroe IslandsFijiFinlandFragile and conflict affected situationsFranceFrench PolynesiaGabonGambia, TheGeorgiaGermanyGhanaGreeceGreenlandGrenadaGuatemalaGuineaGuinea-BissauGuyanaHaitiHeavily indebted poor countries (HIPC)High incomeHondurasHong Kong SAR, ChinaHungaryIBRD onlyIcelandIDA & IBRD totalIDA blendIDA onlyIDA totalIndiaIndonesiaIran, Islamic Rep.IraqIrelandIsraelItalyJamaicaJapanJordanKazakhstanKenyaKiribatiKorea, Dem. People’s Rep.Korea, Rep.KuwaitKyrgyz RepublicLao PDRLate-demographic dividendLatin America & Caribbean Latin America & Caribbean (excluding high income)Latin America & the Caribbean (IDA & IBRD countries)LatviaLeast developed countries: UN classificationLebanonLesothoLiberiaLibyaLithuaniaLow & middle incomeLow incomeLower middle incomeLuxembourgMacao SAR, ChinaMacedonia, FYRMadagascarMalawiMalaysiaMaldivesMaliMaltaMarshall IslandsMauritaniaMauritiusMexicoMicronesia, Fed. Sts.Middle East & North AfricaMiddle East & North Africa (excluding high income)Middle East & North Africa (IDA & IBRD countries)Middle incomeMoldovaMongoliaMontenegroMoroccoMozambiqueMyanmarNamibiaNepalNetherlandsNew CaledoniaNew ZealandNicaraguaNigerNigeriaNorth AmericaNorthern Mariana IslandsNorwayOECD membersOmanOther small statesPacific island small statesPakistanPalauPanamaPapua New GuineaParaguayPeruPhilippinesPolandPortugalPost-demographic dividendPre-demographic dividendQatarRomaniaRussian FederationRwandaSamoaSao Tome and PrincipeSaudi ArabiaSenegalSerbiaSeychellesSierra LeoneSingaporeSint Maarten (Dutch part)Slovak RepublicSloveniaSmall statesSolomon IslandsSouth AfricaSouth AsiaSouth Asia (IDA & IBRD)SpainSri LankaSt. Kitts and NevisSt. LuciaSt. Martin (French part)St. Vincent and the GrenadinesSub-Saharan Africa Sub-Saharan Africa (excluding high income)Sub-Saharan Africa (IDA & IBRD countries)SudanSurinameSwazilandSwedenSwitzerlandSyrian Arab RepublicTajikistanTanzaniaThailandTimor-LesteTogoTongaTrinidad and TobagoTunisiaTurkeyTurkmenistanTuvaluUgandaUkraineUnited Arab EmiratesUnited KingdomUnited StatesUpper middle incomeUruguayUzbekistanVanuatuVenezuela, RBVietnamWorldYemen, Rep.ZambiaZimbabwe Timeline:
This timeline shows a graph from 1961 to 2016 of Guinea. No data until 1960. Number of actual observations by date: 55.
Source name:
World Development Indicators
Source organization:
World Trade Organization.
Categories, topics:
Private Sector, Trade
Last updated:
apr 23, 2017
Indicators value changes by year
Minimum:
46.0 mln
jan 1, 1964
Maximum:
2.254 bln
jan 1, 2013
At the date of observation
Value
Absolute change
Change from previous value
jan 1, 1961
50.0 mln
+50.0 mln
0.0%
jan 1, 1962
73.0 mln
+23.0 mln
46.0%
jan 1, 1963
66.0 mln
-7.0 mln
-9.59%
jan 1, 1964
46.0 mln
-20.0 mln
-30.3%
jan 1, 1965
49.0 mln
+3.0 mln
6.52%
jan 1, 1966
53.0 mln
+4.0 mln
8.16%
jan 1, 1967
70.0 mln
+17.0 mln
32.08%
jan 1, 1968
53.0 mln
-17.0 mln
-24.29%
jan 1, 1969
50.0 mln
-3.0 mln
-5.66%
jan 1, 1970
65.0 mln
+15.0 mln
30.0%
jan 1, 1971
78.0 mln
+13.0 mln
20.0%
jan 1, 1972
80.0 mln
+2.0 mln
2.56%
jan 1, 1973
107.0 mln
+27.0 mln
33.75%
jan 1, 1974
185.0 mln
+78.0 mln
72.9%
jan 1, 1975
160.0 mln
-25.0 mln
-13.51%
jan 1, 1976
216.0 mln
+56.0 mln
35.0%
jan 1, 1977
283.0 mln
+67.0 mln
31.02%
jan 1, 1978
247.0 mln
-36.0 mln
-12.72%
jan 1, 1979
272.0 mln
+25.0 mln
10.12%
jan 1, 1981
360.0 mln
+88.0 mln
32.35%
jan 1, 1982
351.0 mln
-9.0 mln
-2.5%
jan 1, 1983
296.0 mln
-55.0 mln
-15.67%
jan 1, 1984
267.0 mln
-29.0 mln
-9.8%
jan 1, 1985
438.0 mln
+171.0 mln
64.04%
jan 1, 1986
448.0 mln
+10.0 mln
2.28%
jan 1, 1987
451.0 mln
+3.0 mln
0.67%
jan 1, 1988
468.0 mln
+17.0 mln
3.77%
jan 1, 1989
605.0 mln
+137.0 mln
29.27%
jan 1, 1990
589.0 mln
-16.0 mln
-2.64%
jan 1, 1991
723.0 mln
+134.0 mln
22.75%
jan 1, 1992
735.0 mln
+12.0 mln
1.66%
jan 1, 1993
740.0 mln
+5.0 mln
0.68%
jan 1, 1994
730.0 mln
-10.0 mln
-1.35%
jan 1, 1995
706.0 mln
-24.0 mln
-3.29%
jan 1, 1996
818.508 mln
+112.508 mln
15.94%
jan 1, 1997
647.662 mln
-170.846 mln
-20.87%
jan 1, 1998
619.702 mln
-27.96 mln
-4.32%
jan 1, 1999
536.579 mln
-83.123 mln
-13.41%
jan 1, 2000
555.925 mln
+19.346 mln
3.61%
jan 1, 2001
612.0 mln
+56.075 mln
10.09%
jan 1, 2002
601.0 mln
-11.0 mln
-1.8%
jan 1, 2003
667.0 mln
+66.0 mln
10.98%
jan 1, 2004
640.0 mln
-27.0 mln
-4.05%
jan 1, 2005
780.0 mln
+140.0 mln
21.88%
jan 1, 2006
820.0 mln
+40.0 mln
5.13%
jan 1, 2007
956.04 mln
+136.04 mln
16.59%
jan 1, 2008
1.218 bln
+261.57 mln
27.36%
jan 1, 2009
1.366 bln
+148.46 mln
12.19%
jan 1, 2010
1.06 bln
-305.98 mln
-22.4%
jan 1, 2011
1.405 bln
+344.83 mln
32.53%
jan 1, 2012
2.106 bln
+700.67 mln
49.87%
jan 1, 2013
2.254 bln
+148.37 mln
7.05%
jan 1, 2014
2.23 bln
-24.207 mln
-1.07%
jan 1, 2015
2.242 bln
+11.852 mln
0.53%
jan 1, 2016
1.971 bln
-270.998 mln
-12.09%
Ranking of countries by current statistics by years


Comments: