29
/
en
AIzaSyAYiBZKx7MnpbEhh9jyipgxe19OcubqV5w
April 1, 2024
151804
Hong Kong SAR, China
HKG
true
2
1
Merchandise imports (current US$)
2016,2015,2014,2013,2012,2011,2010,2009,2008,2007,2006,2005,2004,2003,2002,2001,2000,1999,1998,1997,1996,1995,1994,1993,1992,1991,1990,1989,1988,1987,1986,1985,1984,1983,1982,1981,1980,1979,1978,1977,1976,1975,1974,1973,1972,1971,1970,1969,1968,1967,1966,1965,1964,1963,1962,1961
This statistics in other country:
AfghanistanAlbaniaAlgeriaAmerican SamoaAngolaAntigua and BarbudaArab WorldArgentinaArmeniaArubaAustraliaAustriaAzerbaijanBahamas, TheBahrainBangladeshBarbadosBelarusBelgiumBelizeBeninBermudaBhutanBoliviaBosnia and HerzegovinaBotswanaBrazilBrunei DarussalamBulgariaBurkina FasoBurundiCabo VerdeCambodiaCameroonCanadaCaribbean small statesCentral African RepublicCentral Europe and the BalticsChadChileChinaColombiaComorosCongo, Dem. Rep.Congo, Rep.Costa RicaCote d'IvoireCroatiaCubaCuracaoCyprusCzech RepublicDenmarkDjiboutiDominicaDominican RepublicEarly-demographic dividendEast Asia & PacificEast Asia & Pacific (excluding high income)East Asia & Pacific (IDA & IBRD countries)EcuadorEgypt, Arab Rep.El SalvadorEquatorial GuineaEritreaEstoniaEthiopiaEuro areaEurope & Central AsiaEurope & Central Asia (excluding high income)Europe & Central Asia (IDA & IBRD countries)European UnionFaroe IslandsFijiFinlandFragile and conflict affected situationsFranceFrench PolynesiaGabonGambia, TheGeorgiaGermanyGhanaGreeceGreenlandGrenadaGuatemalaGuineaGuinea-BissauGuyanaHaitiHeavily indebted poor countries (HIPC)High incomeHondurasHong Kong SAR, ChinaHungaryIBRD onlyIcelandIDA & IBRD totalIDA blendIDA onlyIDA totalIndiaIndonesiaIran, Islamic Rep.IraqIrelandIsraelItalyJamaicaJapanJordanKazakhstanKenyaKiribatiKorea, Dem. People’s Rep.Korea, Rep.KuwaitKyrgyz RepublicLao PDRLate-demographic dividendLatin America & Caribbean Latin America & Caribbean (excluding high income)Latin America & the Caribbean (IDA & IBRD countries)LatviaLeast developed countries: UN classificationLebanonLesothoLiberiaLibyaLithuaniaLow & middle incomeLow incomeLower middle incomeLuxembourgMacao SAR, ChinaMacedonia, FYRMadagascarMalawiMalaysiaMaldivesMaliMaltaMarshall IslandsMauritaniaMauritiusMexicoMicronesia, Fed. Sts.Middle East & North AfricaMiddle East & North Africa (excluding high income)Middle East & North Africa (IDA & IBRD countries)Middle incomeMoldovaMongoliaMontenegroMoroccoMozambiqueMyanmarNamibiaNepalNetherlandsNew CaledoniaNew ZealandNicaraguaNigerNigeriaNorth AmericaNorthern Mariana IslandsNorwayOECD membersOmanOther small statesPacific island small statesPakistanPalauPanamaPapua New GuineaParaguayPeruPhilippinesPolandPortugalPost-demographic dividendPre-demographic dividendQatarRomaniaRussian FederationRwandaSamoaSao Tome and PrincipeSaudi ArabiaSenegalSerbiaSeychellesSierra LeoneSingaporeSint Maarten (Dutch part)Slovak RepublicSloveniaSmall statesSolomon IslandsSouth AfricaSouth AsiaSouth Asia (IDA & IBRD)SpainSri LankaSt. Kitts and NevisSt. LuciaSt. Martin (French part)St. Vincent and the GrenadinesSub-Saharan Africa Sub-Saharan Africa (excluding high income)Sub-Saharan Africa (IDA & IBRD countries)SudanSurinameSwazilandSwedenSwitzerlandSyrian Arab RepublicTajikistanTanzaniaThailandTimor-LesteTogoTongaTrinidad and TobagoTunisiaTurkeyTurkmenistanTuvaluUgandaUkraineUnited Arab EmiratesUnited KingdomUnited StatesUpper middle incomeUruguayUzbekistanVanuatuVenezuela, RBVietnamWorldYemen, Rep.ZambiaZimbabwe Timeline:
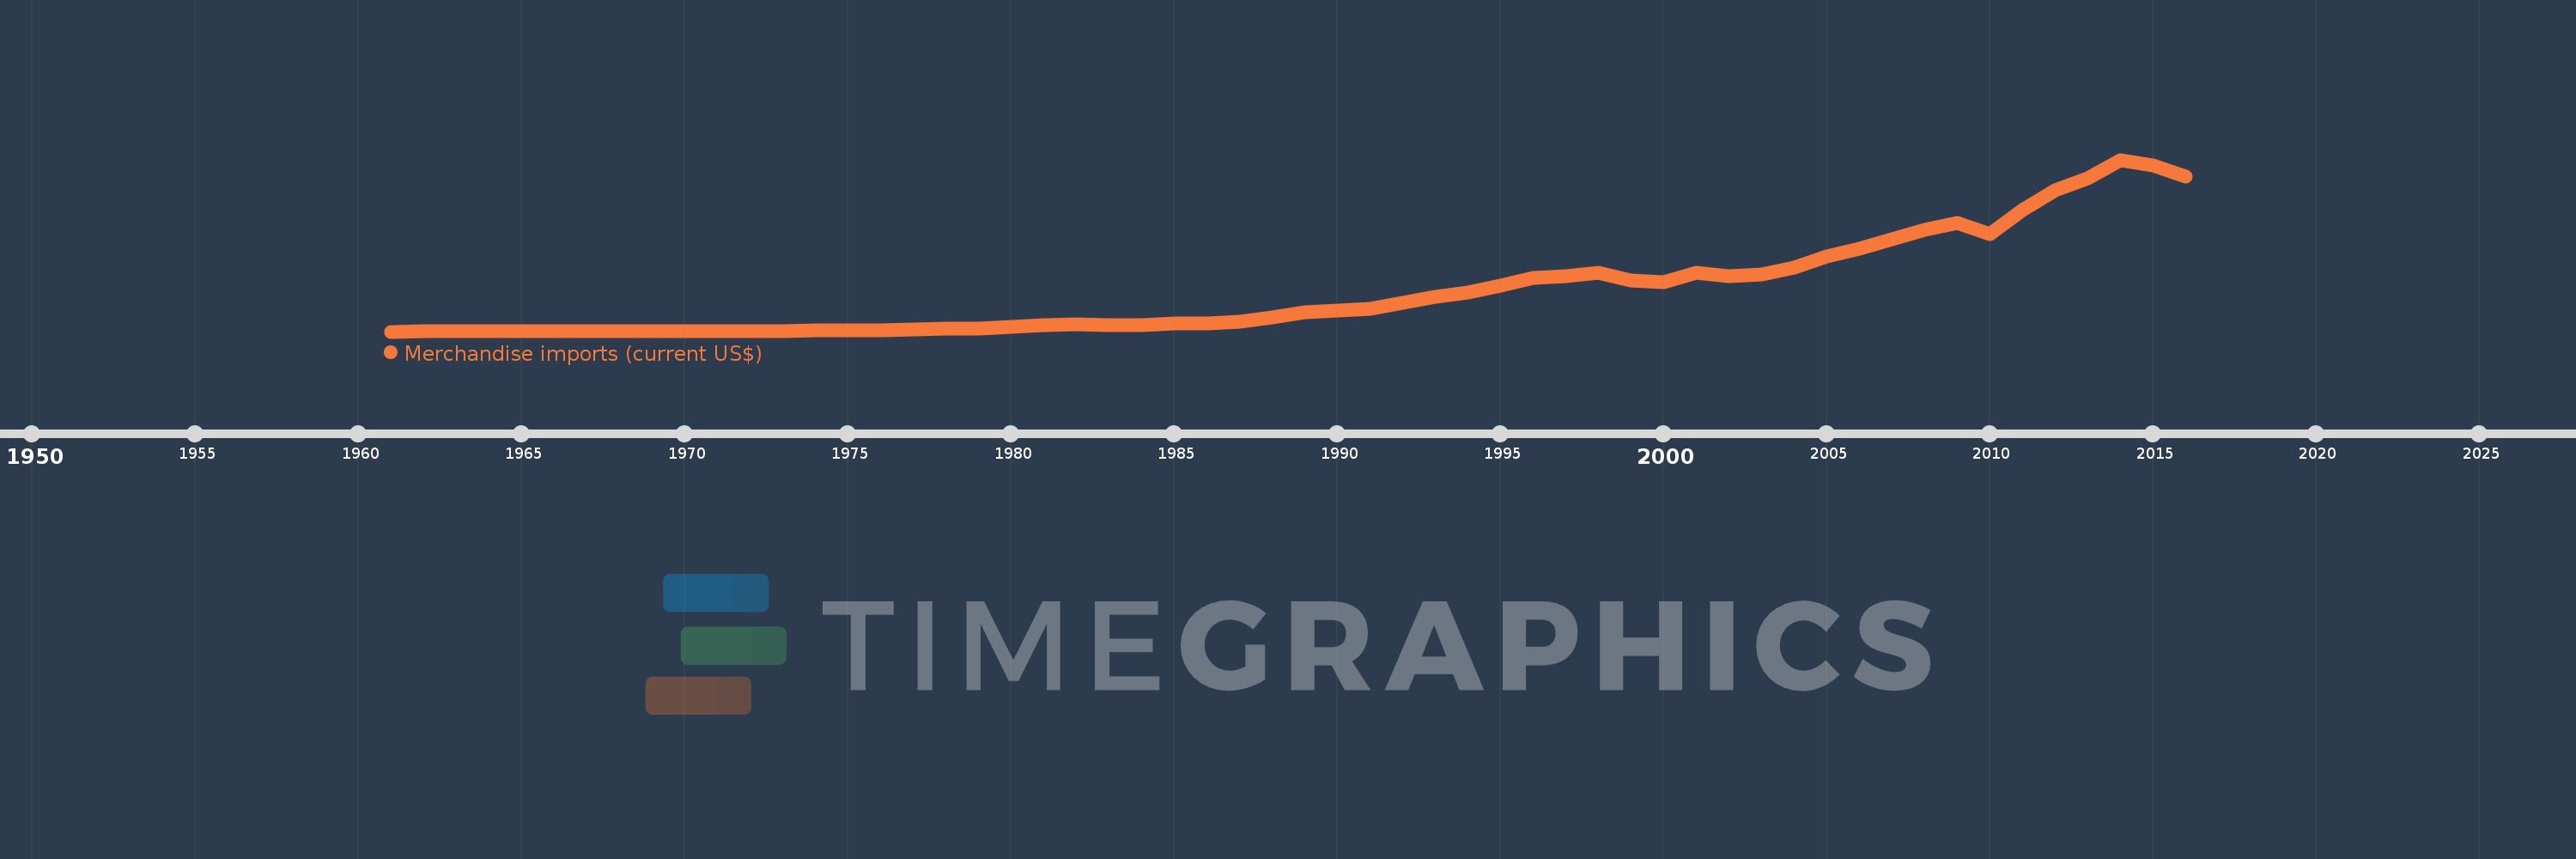
This timeline shows a graph from 1961 to 2016 of Hong Kong SAR, China. No data until 1960. Number of actual observations by date: 56.
Source name:
World Development Indicators
Source organization:
World Trade Organization.
Categories, topics:
Private Sector, Trade
Last updated:
apr 23, 2017
Indicators value changes by year
Minimum:
1.026 bln
jan 1, 1961
Maximum:
621.417 bln
jan 1, 2014
At the date of observation
Value
Absolute change
Change from previous value
jan 1, 1961
1.026 bln
+1.026 bln
0.0%
jan 1, 1962
1.045 bln
+18.9 mln
1.84%
jan 1, 1963
1.165 bln
+120.05 mln
11.49%
jan 1, 1964
1.297 bln
+131.95 mln
11.32%
jan 1, 1965
1.496 bln
+198.97 mln
15.34%
jan 1, 1966
1.569 bln
+72.8 mln
4.87%
jan 1, 1967
1.767 bln
+198.1 mln
12.63%
jan 1, 1968
1.818 bln
+51.31 mln
2.9%
jan 1, 1969
2.058 bln
+239.44 mln
13.17%
jan 1, 1970
2.458 bln
+399.79 mln
19.43%
jan 1, 1971
2.905 bln
+447.65 mln
18.22%
jan 1, 1972
3.391 bln
+485.76 mln
16.72%
jan 1, 1973
3.856 bln
+465.29 mln
13.72%
jan 1, 1974
5.655 bln
+1.799 bln
46.65%
jan 1, 1975
6.778 bln
+1.123 bln
19.86%
jan 1, 1976
6.766 bln
-12.37 mln
-0.18%
jan 1, 1977
8.838 bln
+2.072 bln
30.62%
jan 1, 1978
10.446 bln
+1.609 bln
18.2%
jan 1, 1979
13.394 bln
+2.948 bln
28.22%
jan 1, 1980
17.127 bln
+3.733 bln
27.87%
jan 1, 1981
22.994 bln
+5.867 bln
34.26%
jan 1, 1982
26.136 bln
+3.142 bln
13.66%
jan 1, 1983
24.867 bln
-1.269 bln
-4.86%
jan 1, 1984
24.409 bln
-458.0 mln
-1.84%
jan 1, 1985
30.444 bln
+6.035 bln
24.72%
jan 1, 1986
31.195 bln
+751.0 mln
2.47%
jan 1, 1987
35.942 bln
+4.747 bln
15.22%
jan 1, 1988
50.691 bln
+14.749 bln
41.04%
jan 1, 1989
70.325 bln
+19.634 bln
38.73%
jan 1, 1990
77.662 bln
+7.337 bln
10.43%
jan 1, 1991
84.725 bln
+7.063 bln
9.09%
jan 1, 1992
103.883 bln
+19.158 bln
22.61%
jan 1, 1993
127.34 bln
+23.457 bln
22.58%
jan 1, 1994
141.308 bln
+13.968 bln
10.97%
jan 1, 1995
165.878 bln
+24.57 bln
17.39%
jan 1, 1996
196.072 bln
+30.194 bln
18.2%
jan 1, 1997
201.284 bln
+5.212 bln
2.66%
jan 1, 1998
213.297 bln
+12.013 bln
5.97%
jan 1, 1999
186.759 bln
-26.538 bln
-12.44%
jan 1, 2000
180.711 bln
-6.048 bln
-3.24%
jan 1, 2001
214.042 bln
+33.331 bln
18.44%
jan 1, 2002
202.008 bln
-12.034 bln
-5.62%
jan 1, 2003
207.969 bln
+5.961 bln
2.95%
jan 1, 2004
233.249 bln
+25.28 bln
12.16%
jan 1, 2005
272.893 bln
+39.644 bln
17.0%
jan 1, 2006
300.16 bln
+27.267 bln
9.99%
jan 1, 2007
335.754 bln
+35.594 bln
11.86%
jan 1, 2008
370.132 bln
+34.379 bln
10.24%
jan 1, 2009
392.962 bln
+22.83 bln
6.17%
jan 1, 2010
352.241 bln
-40.722 bln
-10.36%
jan 1, 2011
441.369 bln
+89.128 bln
25.3%
jan 1, 2012
510.855 bln
+69.486 bln
15.74%
jan 1, 2013
553.486 bln
+42.632 bln
8.35%
jan 1, 2014
621.417 bln
+67.93 bln
12.27%
jan 1, 2015
600.613 bln
-20.804 bln
-3.35%
jan 1, 2016
559.427 bln
-41.186 bln
-6.86%
Ranking of countries by current statistics by years


Comments: