29
/
en
AIzaSyAYiBZKx7MnpbEhh9jyipgxe19OcubqV5w
April 1, 2024
55710
Pre-demographic dividend
PRE
false
2
1
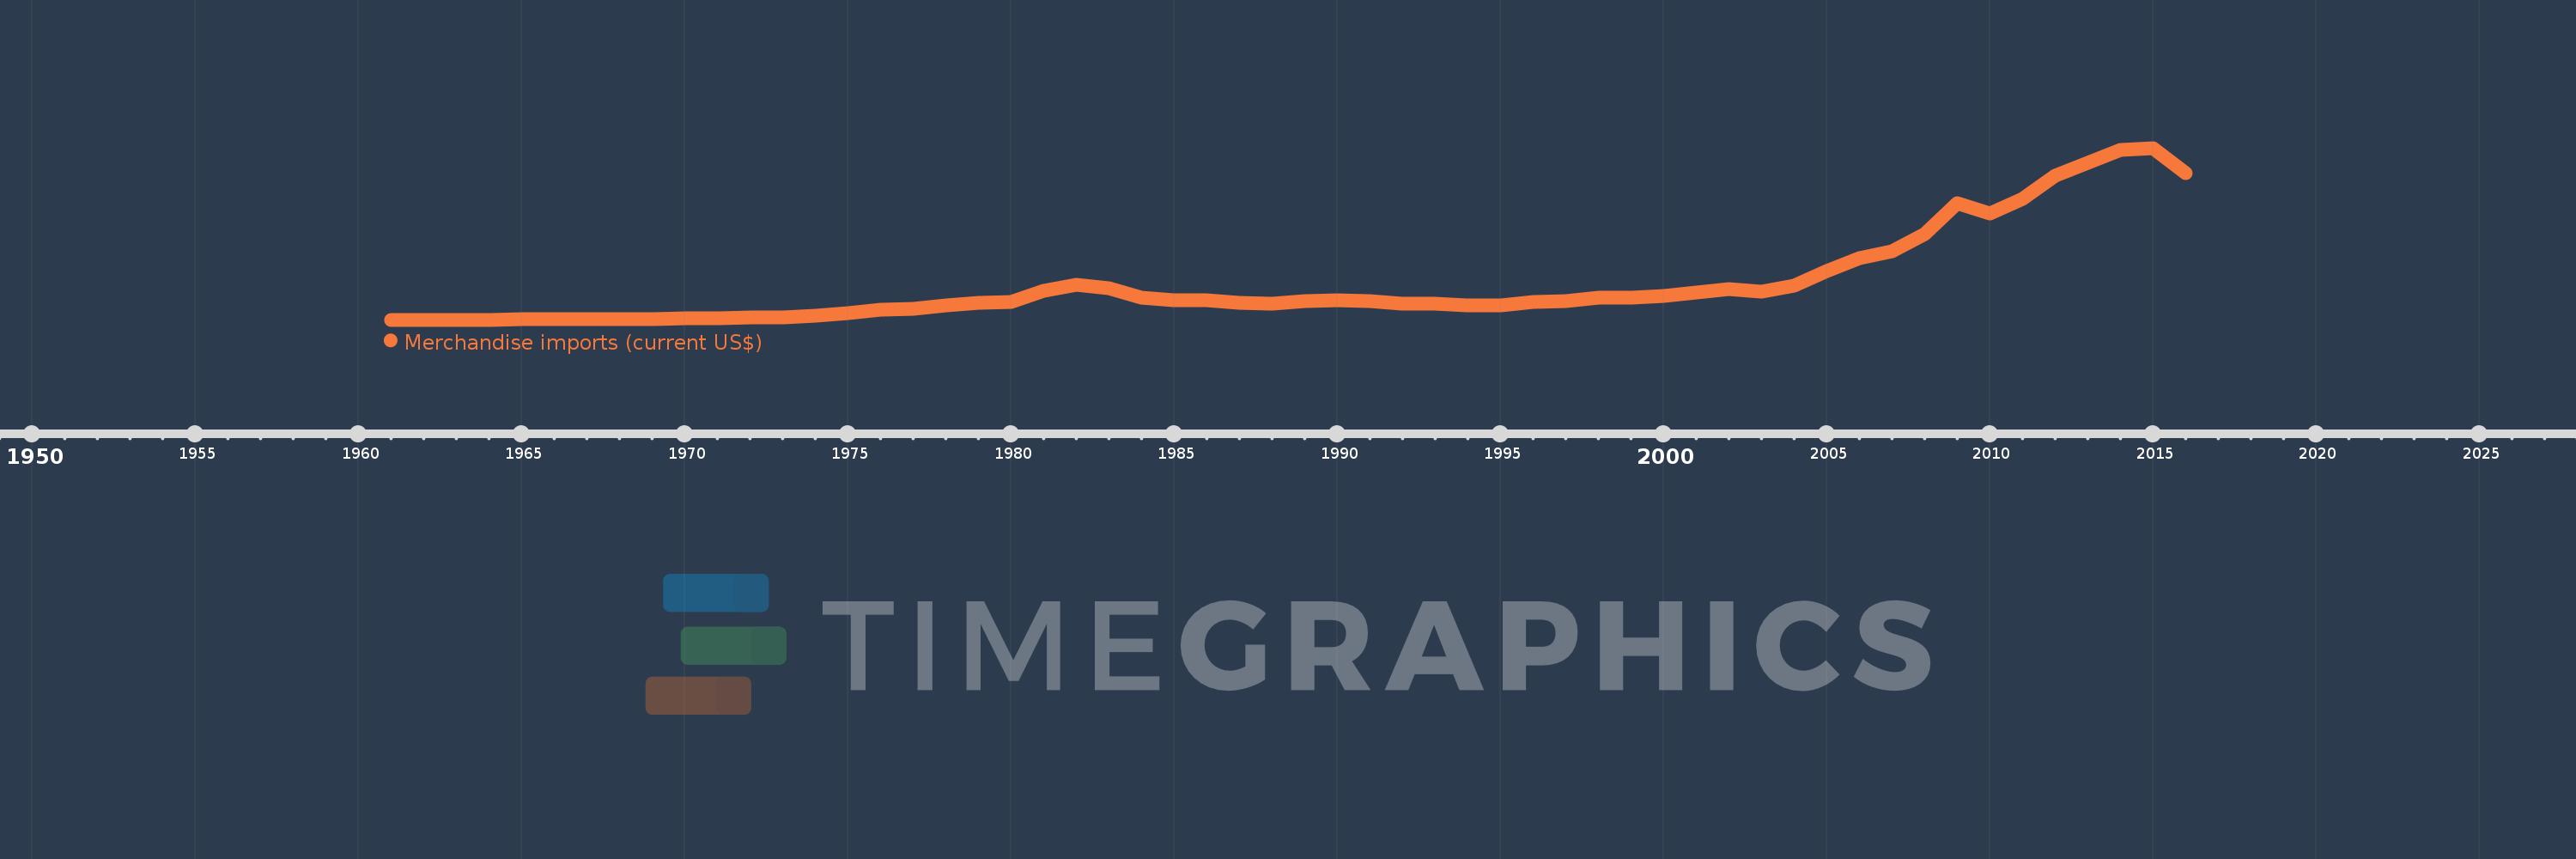
Merchandise imports (current US$)
2016,2015,2014,2013,2012,2011,2010,2009,2008,2007,2006,2005,2004,2003,2002,2001,2000,1999,1998,1997,1996,1995,1994,1993,1992,1991,1990,1989,1988,1987,1986,1985,1984,1983,1982,1981,1980,1979,1978,1977,1976,1975,1974,1973,1972,1971,1970,1969,1968,1967,1966,1965,1964,1963,1962,1961
This statistics in other country:
AfghanistanAlbaniaAlgeriaAmerican SamoaAngolaAntigua and BarbudaArab WorldArgentinaArmeniaArubaAustraliaAustriaAzerbaijanBahamas, TheBahrainBangladeshBarbadosBelarusBelgiumBelizeBeninBermudaBhutanBoliviaBosnia and HerzegovinaBotswanaBrazilBrunei DarussalamBulgariaBurkina FasoBurundiCabo VerdeCambodiaCameroonCanadaCaribbean small statesCentral African RepublicCentral Europe and the BalticsChadChileChinaColombiaComorosCongo, Dem. Rep.Congo, Rep.Costa RicaCote d'IvoireCroatiaCubaCuracaoCyprusCzech RepublicDenmarkDjiboutiDominicaDominican RepublicEarly-demographic dividendEast Asia & PacificEast Asia & Pacific (excluding high income)East Asia & Pacific (IDA & IBRD countries)EcuadorEgypt, Arab Rep.El SalvadorEquatorial GuineaEritreaEstoniaEthiopiaEuro areaEurope & Central AsiaEurope & Central Asia (excluding high income)Europe & Central Asia (IDA & IBRD countries)European UnionFaroe IslandsFijiFinlandFragile and conflict affected situationsFranceFrench PolynesiaGabonGambia, TheGeorgiaGermanyGhanaGreeceGreenlandGrenadaGuatemalaGuineaGuinea-BissauGuyanaHaitiHeavily indebted poor countries (HIPC)High incomeHondurasHong Kong SAR, ChinaHungaryIBRD onlyIcelandIDA & IBRD totalIDA blendIDA onlyIDA totalIndiaIndonesiaIran, Islamic Rep.IraqIrelandIsraelItalyJamaicaJapanJordanKazakhstanKenyaKiribatiKorea, Dem. People’s Rep.Korea, Rep.KuwaitKyrgyz RepublicLao PDRLate-demographic dividendLatin America & Caribbean Latin America & Caribbean (excluding high income)Latin America & the Caribbean (IDA & IBRD countries)LatviaLeast developed countries: UN classificationLebanonLesothoLiberiaLibyaLithuaniaLow & middle incomeLow incomeLower middle incomeLuxembourgMacao SAR, ChinaMacedonia, FYRMadagascarMalawiMalaysiaMaldivesMaliMaltaMarshall IslandsMauritaniaMauritiusMexicoMicronesia, Fed. Sts.Middle East & North AfricaMiddle East & North Africa (excluding high income)Middle East & North Africa (IDA & IBRD countries)Middle incomeMoldovaMongoliaMontenegroMoroccoMozambiqueMyanmarNamibiaNepalNetherlandsNew CaledoniaNew ZealandNicaraguaNigerNigeriaNorth AmericaNorthern Mariana IslandsNorwayOECD membersOmanOther small statesPacific island small statesPakistanPalauPanamaPapua New GuineaParaguayPeruPhilippinesPolandPortugalPost-demographic dividendPre-demographic dividendQatarRomaniaRussian FederationRwandaSamoaSao Tome and PrincipeSaudi ArabiaSenegalSerbiaSeychellesSierra LeoneSingaporeSint Maarten (Dutch part)Slovak RepublicSloveniaSmall statesSolomon IslandsSouth AfricaSouth AsiaSouth Asia (IDA & IBRD)SpainSri LankaSt. Kitts and NevisSt. LuciaSt. Martin (French part)St. Vincent and the GrenadinesSub-Saharan Africa Sub-Saharan Africa (excluding high income)Sub-Saharan Africa (IDA & IBRD countries)SudanSurinameSwazilandSwedenSwitzerlandSyrian Arab RepublicTajikistanTanzaniaThailandTimor-LesteTogoTongaTrinidad and TobagoTunisiaTurkeyTurkmenistanTuvaluUgandaUkraineUnited Arab EmiratesUnited KingdomUnited StatesUpper middle incomeUruguayUzbekistanVanuatuVenezuela, RBVietnamWorldYemen, Rep.ZambiaZimbabwe Timeline:
This timeline shows a graph from 1961 to 2016 of Pre-demographic dividend. No data until 1960. Number of actual observations by date: 56.
Source name:
World Development Indicators
Source organization:
World Trade Organization.
Categories, topics:
Private Sector, Trade
Last updated:
apr 23, 2017
Indicators value changes by year
Minimum:
3.526 bln
jan 1, 1961
Maximum:
307.393 bln
jan 1, 2015
At the date of observation
Value
Absolute change
Change from previous value
jan 1, 1961
3.526 bln
+3.526 bln
0.0%
jan 1, 1962
3.745 bln
+219.313 mln
6.22%
jan 1, 1963
3.626 bln
-118.522 mln
-3.16%
jan 1, 1964
3.723 bln
+96.34 mln
2.66%
jan 1, 1965
4.225 bln
+502.596 mln
13.5%
jan 1, 1966
4.551 bln
+326.019 mln
7.72%
jan 1, 1967
4.83 bln
+278.731 mln
6.12%
jan 1, 1968
4.887 bln
+57.296 mln
1.19%
jan 1, 1969
5.062 bln
+174.522 mln
3.57%
jan 1, 1970
5.489 bln
+427.402 mln
8.44%
jan 1, 1971
6.506 bln
+1.017 bln
18.52%
jan 1, 1972
7.902 bln
+1.396 bln
21.45%
jan 1, 1973
8.113 bln
+210.814 mln
2.67%
jan 1, 1974
10.133 bln
+2.02 bln
24.9%
jan 1, 1975
15.013 bln
+4.881 bln
48.17%
jan 1, 1976
21.386 bln
+6.372 bln
42.44%
jan 1, 1977
22.406 bln
+1.02 bln
4.77%
jan 1, 1978
28.257 bln
+5.851 bln
26.11%
jan 1, 1979
33.586 bln
+5.329 bln
18.86%
jan 1, 1980
35.646 bln
+2.06 bln
6.13%
jan 1, 1981
55.314 bln
+19.668 bln
55.17%
jan 1, 1982
65.378 bln
+10.064 bln
18.19%
jan 1, 1983
59.112 bln
-6.266 bln
-9.58%
jan 1, 1984
43.272 bln
-15.839 bln
-26.8%
jan 1, 1985
38.548 bln
-4.724 bln
-10.92%
jan 1, 1986
37.952 bln
-596.7 mln
-1.55%
jan 1, 1987
33.934 bln
-4.017 bln
-10.59%
jan 1, 1988
32.625 bln
-1.309 bln
-3.86%
jan 1, 1989
36.849 bln
+4.225 bln
12.95%
jan 1, 1990
38.283 bln
+1.434 bln
3.89%
jan 1, 1991
36.896 bln
-1.387 bln
-3.62%
jan 1, 1992
31.2 bln
-5.696 bln
-15.44%
jan 1, 1993
31.363 bln
+162.756 mln
0.52%
jan 1, 1994
29.205 bln
-2.159 bln
-6.88%
jan 1, 1995
28.457 bln
-747.803 mln
-2.56%
jan 1, 1996
34.647 bln
+6.19 bln
21.75%
jan 1, 1997
35.957 bln
+1.31 bln
3.78%
jan 1, 1998
42.09 bln
+6.133 bln
17.06%
jan 1, 1999
42.584 bln
+493.772 mln
1.17%
jan 1, 2000
44.954 bln
+2.37 bln
5.57%
jan 1, 2001
52.243 bln
+7.289 bln
16.22%
jan 1, 2002
57.945 bln
+5.702 bln
10.91%
jan 1, 2003
53.59 bln
-4.356 bln
-7.52%
jan 1, 2004
64.402 bln
+10.812 bln
20.18%
jan 1, 2005
89.13 bln
+24.728 bln
38.4%
jan 1, 2006
111.881 bln
+22.751 bln
25.53%
jan 1, 2007
124.706 bln
+12.824 bln
11.46%
jan 1, 2008
154.488 bln
+29.782 bln
23.88%
jan 1, 2009
210.242 bln
+55.754 bln
36.09%
jan 1, 2010
191.978 bln
-18.264 bln
-8.69%
jan 1, 2011
216.785 bln
+24.807 bln
12.92%
jan 1, 2012
257.88 bln
+41.095 bln
18.96%
jan 1, 2013
280.718 bln
+22.839 bln
8.86%
jan 1, 2014
303.485 bln
+22.767 bln
8.11%
jan 1, 2015
307.393 bln
+3.908 bln
1.29%
jan 1, 2016
263.07 bln
-44.324 bln
-14.42%
Ranking of countries by current statistics by years


Comments: