29
/
en
AIzaSyAYiBZKx7MnpbEhh9jyipgxe19OcubqV5w
April 1, 2024
52814
OECD members
OED
false
2
1
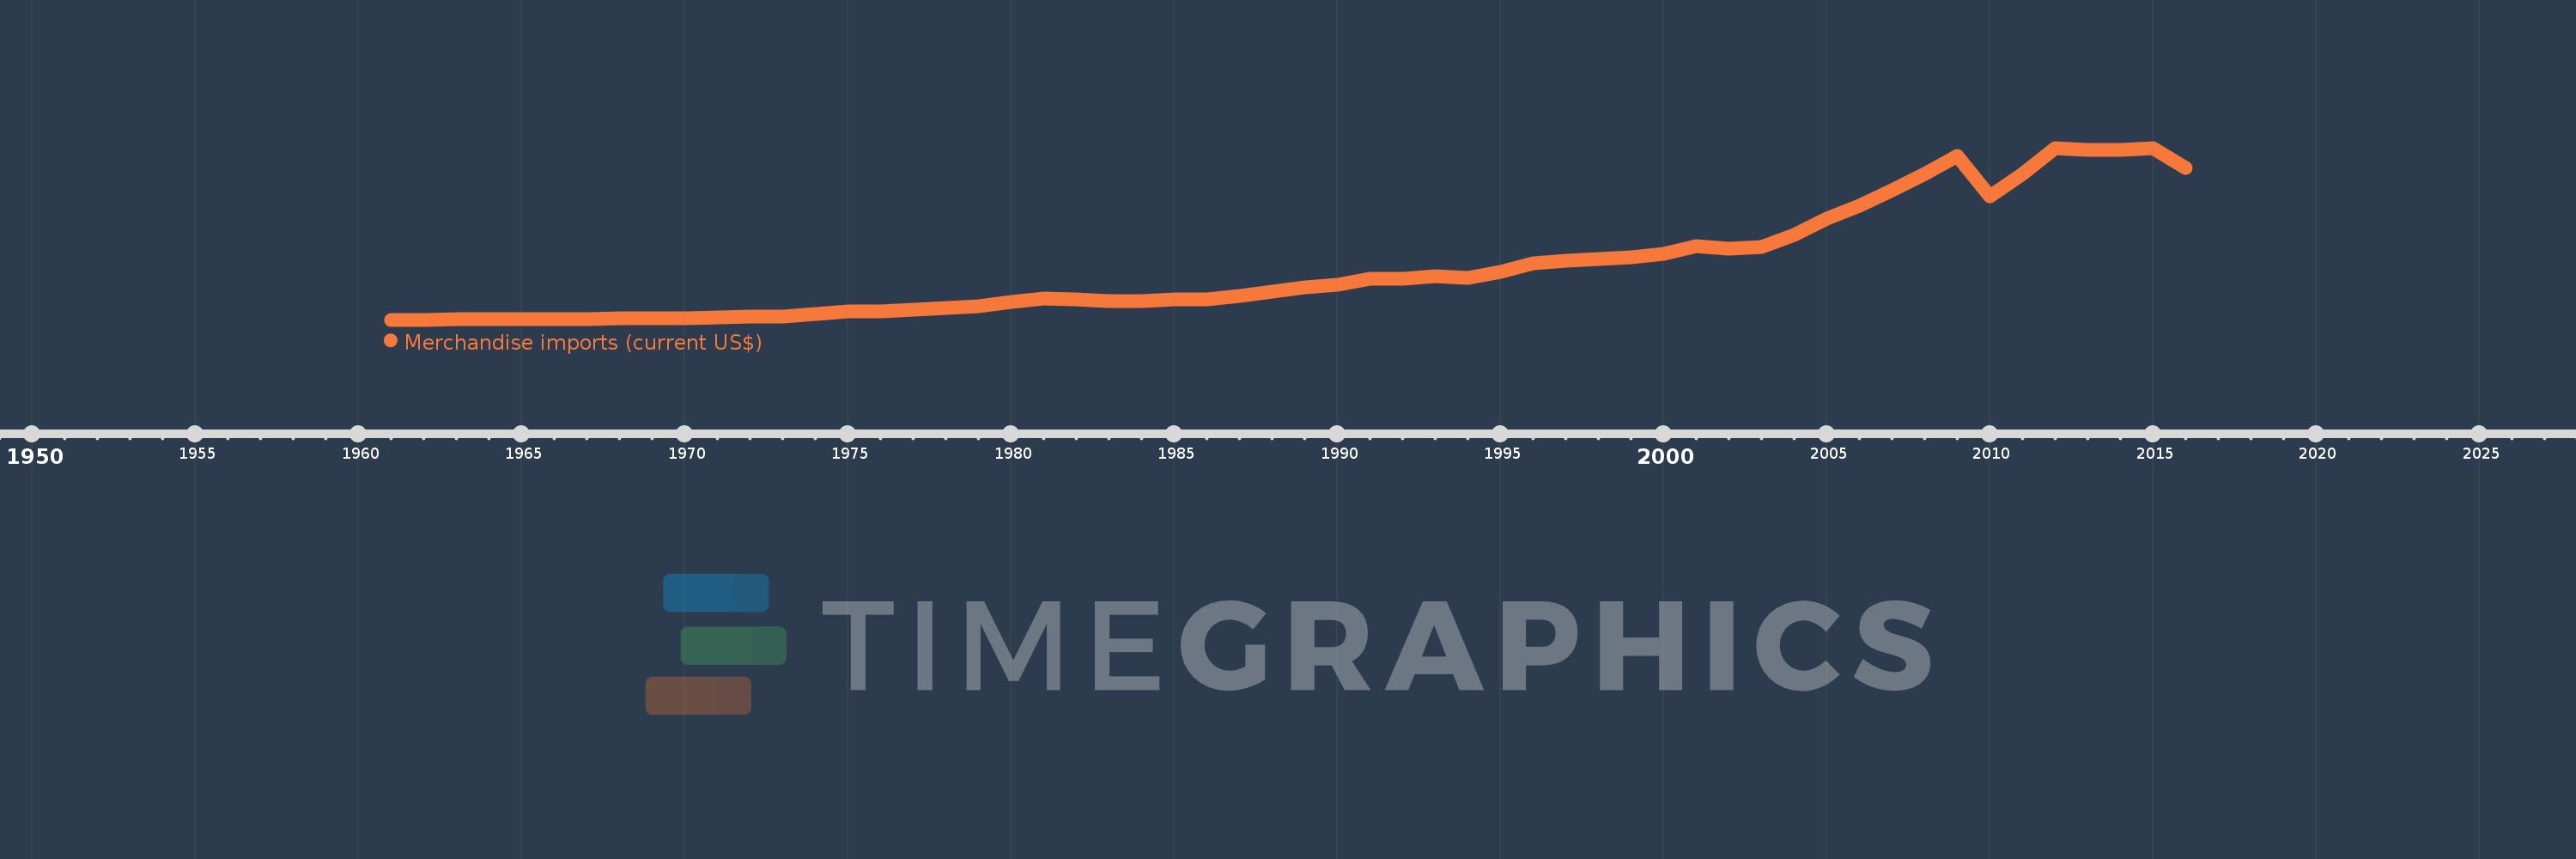
Merchandise imports (current US$)
2016,2015,2014,2013,2012,2011,2010,2009,2008,2007,2006,2005,2004,2003,2002,2001,2000,1999,1998,1997,1996,1995,1994,1993,1992,1991,1990,1989,1988,1987,1986,1985,1984,1983,1982,1981,1980,1979,1978,1977,1976,1975,1974,1973,1972,1971,1970,1969,1968,1967,1966,1965,1964,1963,1962,1961
This statistics in other country:
AfghanistanAlbaniaAlgeriaAmerican SamoaAngolaAntigua and BarbudaArab WorldArgentinaArmeniaArubaAustraliaAustriaAzerbaijanBahamas, TheBahrainBangladeshBarbadosBelarusBelgiumBelizeBeninBermudaBhutanBoliviaBosnia and HerzegovinaBotswanaBrazilBrunei DarussalamBulgariaBurkina FasoBurundiCabo VerdeCambodiaCameroonCanadaCaribbean small statesCentral African RepublicCentral Europe and the BalticsChadChileChinaColombiaComorosCongo, Dem. Rep.Congo, Rep.Costa RicaCote d'IvoireCroatiaCubaCuracaoCyprusCzech RepublicDenmarkDjiboutiDominicaDominican RepublicEarly-demographic dividendEast Asia & PacificEast Asia & Pacific (excluding high income)East Asia & Pacific (IDA & IBRD countries)EcuadorEgypt, Arab Rep.El SalvadorEquatorial GuineaEritreaEstoniaEthiopiaEuro areaEurope & Central AsiaEurope & Central Asia (excluding high income)Europe & Central Asia (IDA & IBRD countries)European UnionFaroe IslandsFijiFinlandFragile and conflict affected situationsFranceFrench PolynesiaGabonGambia, TheGeorgiaGermanyGhanaGreeceGreenlandGrenadaGuatemalaGuineaGuinea-BissauGuyanaHaitiHeavily indebted poor countries (HIPC)High incomeHondurasHong Kong SAR, ChinaHungaryIBRD onlyIcelandIDA & IBRD totalIDA blendIDA onlyIDA totalIndiaIndonesiaIran, Islamic Rep.IraqIrelandIsraelItalyJamaicaJapanJordanKazakhstanKenyaKiribatiKorea, Dem. People’s Rep.Korea, Rep.KuwaitKyrgyz RepublicLao PDRLate-demographic dividendLatin America & Caribbean Latin America & Caribbean (excluding high income)Latin America & the Caribbean (IDA & IBRD countries)LatviaLeast developed countries: UN classificationLebanonLesothoLiberiaLibyaLithuaniaLow & middle incomeLow incomeLower middle incomeLuxembourgMacao SAR, ChinaMacedonia, FYRMadagascarMalawiMalaysiaMaldivesMaliMaltaMarshall IslandsMauritaniaMauritiusMexicoMicronesia, Fed. Sts.Middle East & North AfricaMiddle East & North Africa (excluding high income)Middle East & North Africa (IDA & IBRD countries)Middle incomeMoldovaMongoliaMontenegroMoroccoMozambiqueMyanmarNamibiaNepalNetherlandsNew CaledoniaNew ZealandNicaraguaNigerNigeriaNorth AmericaNorthern Mariana IslandsNorwayOECD membersOmanOther small statesPacific island small statesPakistanPalauPanamaPapua New GuineaParaguayPeruPhilippinesPolandPortugalPost-demographic dividendPre-demographic dividendQatarRomaniaRussian FederationRwandaSamoaSao Tome and PrincipeSaudi ArabiaSenegalSerbiaSeychellesSierra LeoneSingaporeSint Maarten (Dutch part)Slovak RepublicSloveniaSmall statesSolomon IslandsSouth AfricaSouth AsiaSouth Asia (IDA & IBRD)SpainSri LankaSt. Kitts and NevisSt. LuciaSt. Martin (French part)St. Vincent and the GrenadinesSub-Saharan Africa Sub-Saharan Africa (excluding high income)Sub-Saharan Africa (IDA & IBRD countries)SudanSurinameSwazilandSwedenSwitzerlandSyrian Arab RepublicTajikistanTanzaniaThailandTimor-LesteTogoTongaTrinidad and TobagoTunisiaTurkeyTurkmenistanTuvaluUgandaUkraineUnited Arab EmiratesUnited KingdomUnited StatesUpper middle incomeUruguayUzbekistanVanuatuVenezuela, RBVietnamWorldYemen, Rep.ZambiaZimbabwe Timeline:
This timeline shows a graph from 1961 to 2016 of OECD members. No data until 1960. Number of actual observations by date: 56.
Source name:
World Development Indicators
Source organization:
World Trade Organization.
Categories, topics:
Private Sector, Trade
Last updated:
apr 23, 2017
Indicators value changes by year
Minimum:
94.227 bln
jan 1, 1961
Maximum:
11.53 trl
jan 1, 2015
At the date of observation
Value
Absolute change
Change from previous value
jan 1, 1961
94.227 bln
+94.227 bln
0.0%
jan 1, 1962
99.198 bln
+4.972 bln
5.28%
jan 1, 1963
106.911 bln
+7.713 bln
7.77%
jan 1, 1964
117.449 bln
+10.538 bln
9.86%
jan 1, 1965
131.877 bln
+14.428 bln
12.28%
jan 1, 1966
144.565 bln
+12.689 bln
9.62%
jan 1, 1967
159.789 bln
+15.224 bln
10.53%
jan 1, 1968
167.966 bln
+8.177 bln
5.12%
jan 1, 1969
189.006 bln
+21.039 bln
12.53%
jan 1, 1970
217.21 bln
+28.204 bln
14.92%
jan 1, 1971
250.256 bln
+33.046 bln
15.21%
jan 1, 1972
278.035 bln
+27.778 bln
11.1%
jan 1, 1973
330.789 bln
+52.754 bln
18.97%
jan 1, 1974
455.916 bln
+125.127 bln
37.83%
jan 1, 1975
651.499 bln
+195.583 bln
42.9%
jan 1, 1976
657.421 bln
+5.922 bln
0.91%
jan 1, 1977
752.746 bln
+95.325 bln
14.5%
jan 1, 1978
850.748 bln
+98.002 bln
13.02%
jan 1, 1979
984.302 bln
+133.554 bln
15.7%
jan 1, 1980
1.259 trl
+274.503 bln
27.89%
jan 1, 1981
1.504 trl
+245.473 bln
19.5%
jan 1, 1982
1.443 trl
-61.209 bln
-4.07%
jan 1, 1983
1.34 trl
-103.354 bln
-7.16%
jan 1, 1984
1.313 trl
-26.469 bln
-1.98%
jan 1, 1985
1.44 trl
+127.045 bln
9.67%
jan 1, 1986
1.478 trl
+37.513 bln
2.6%
jan 1, 1987
1.661 trl
+183.012 bln
12.38%
jan 1, 1988
1.967 trl
+306.682 bln
18.47%
jan 1, 1989
2.233 trl
+265.799 bln
13.51%
jan 1, 1990
2.424 trl
+190.275 bln
8.52%
jan 1, 1991
2.799 trl
+375.928 bln
15.51%
jan 1, 1992
2.838 trl
+38.662 bln
1.38%
jan 1, 1993
2.982 trl
+143.393 bln
5.05%
jan 1, 1994
2.857 trl
-124.173 bln
-4.16%
jan 1, 1995
3.254 trl
+396.239 bln
13.87%
jan 1, 1996
3.846 trl
+592.014 bln
18.2%
jan 1, 1997
4.038 trl
+192.034 bln
4.99%
jan 1, 1998
4.144 trl
+106.586 bln
2.64%
jan 1, 1999
4.238 trl
+94.137 bln
2.27%
jan 1, 2000
4.464 trl
+225.643 bln
5.32%
jan 1, 2001
5.019 trl
+555.374 bln
12.44%
jan 1, 2002
4.802 trl
-217.282 bln
-4.33%
jan 1, 2003
4.957 trl
+155.256 bln
3.23%
jan 1, 2004
5.732 trl
+774.332 bln
15.62%
jan 1, 2005
6.842 trl
+1.11 trl
19.36%
jan 1, 2006
7.654 trl
+812.12 bln
11.87%
jan 1, 2007
8.683 trl
+1.029 trl
13.44%
jan 1, 2008
9.801 trl
+1.118 trl
12.88%
jan 1, 2009
11.001 trl
+1.2 trl
12.25%
jan 1, 2010
8.285 trl
-2.716 trl
-24.69%
jan 1, 2011
9.778 trl
+1.492 trl
18.01%
jan 1, 2012
11.504 trl
+1.726 trl
17.65%
jan 1, 2013
11.372 trl
-131.273 bln
-1.14%
jan 1, 2014
11.385 trl
+12.447 bln
0.11%
jan 1, 2015
11.53 trl
+145.033 bln
1.27%
jan 1, 2016
10.202 trl
-1.328 trl
-11.52%
Ranking of countries by current statistics by years


Comments: