29
/
en
AIzaSyAYiBZKx7MnpbEhh9jyipgxe19OcubqV5w
April 1, 2024
40898
Late-demographic dividend
LTE
false
2
1
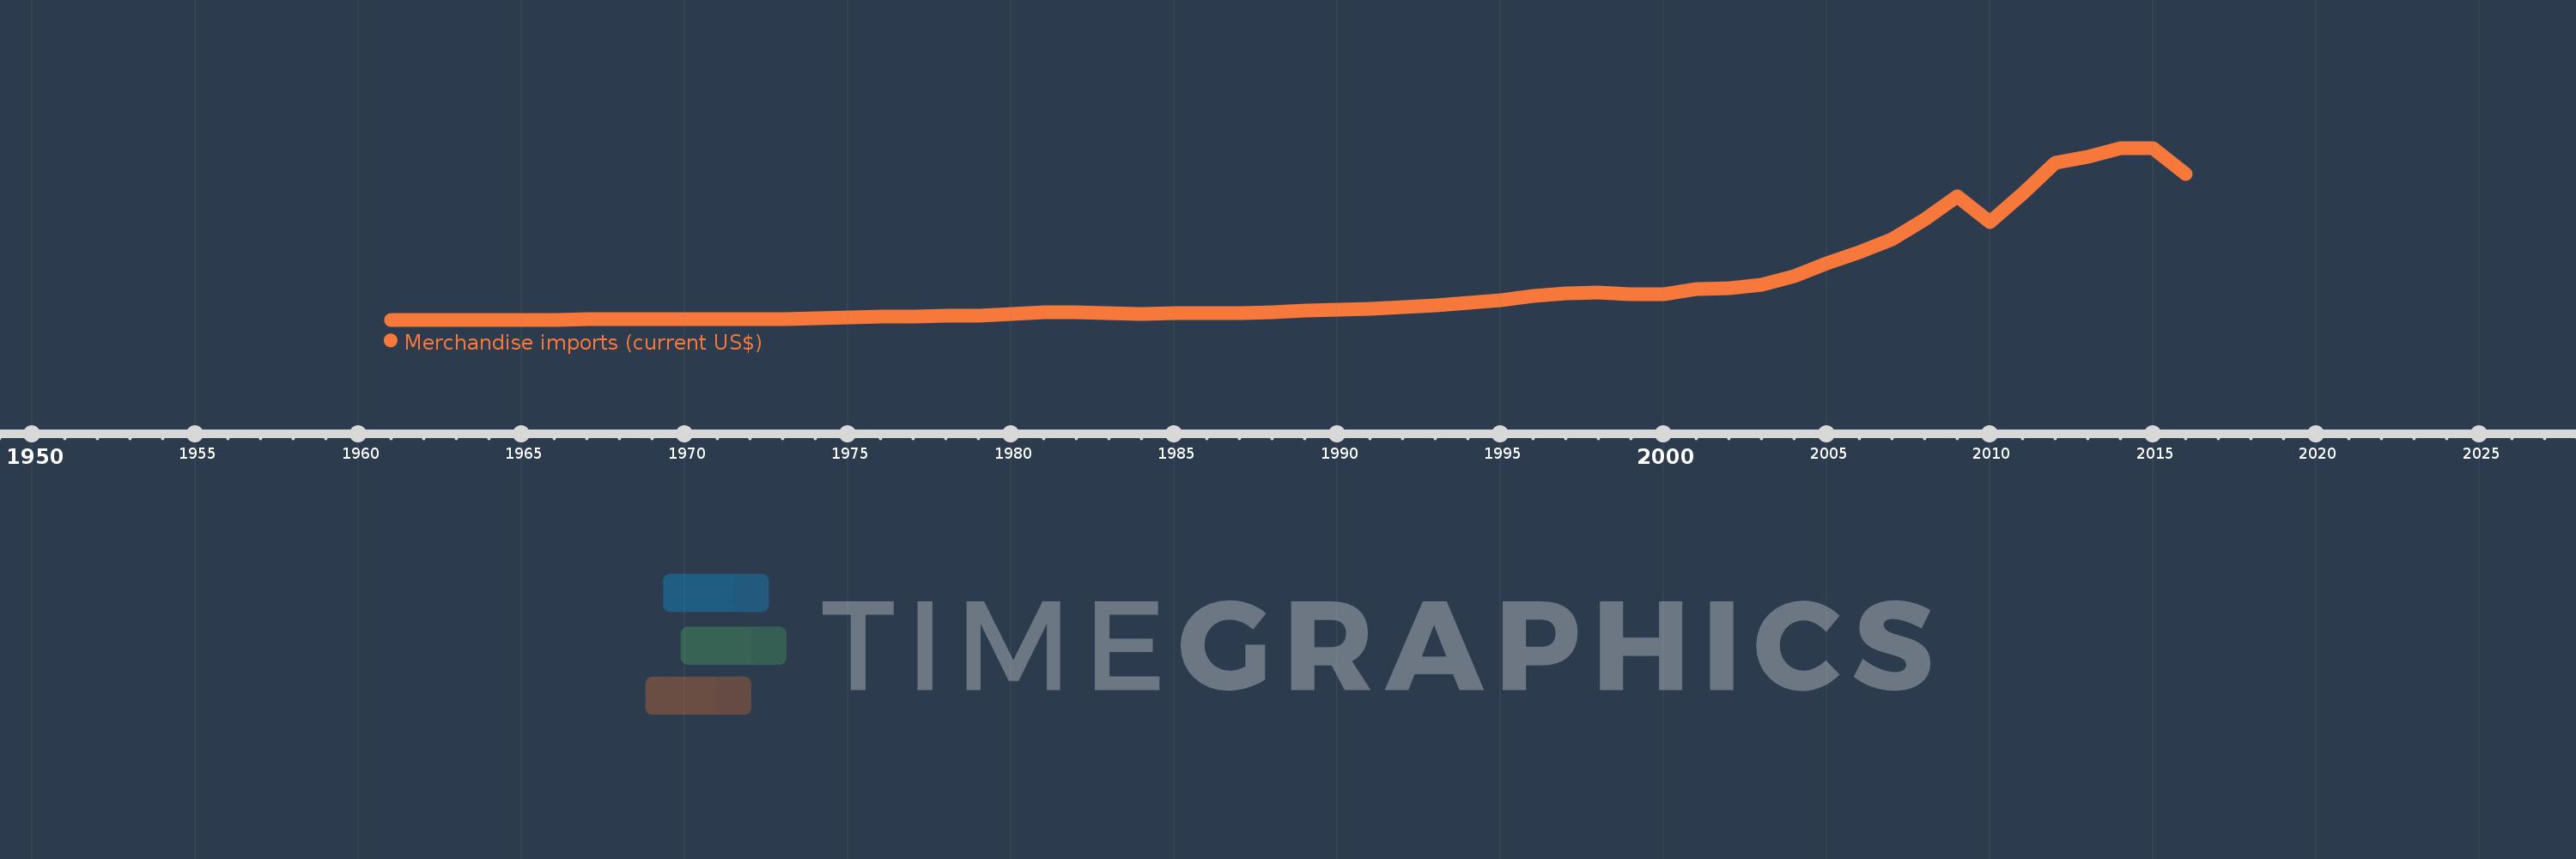
Merchandise imports (current US$)
2016,2015,2014,2013,2012,2011,2010,2009,2008,2007,2006,2005,2004,2003,2002,2001,2000,1999,1998,1997,1996,1995,1994,1993,1992,1991,1990,1989,1988,1987,1986,1985,1984,1983,1982,1981,1980,1979,1978,1977,1976,1975,1974,1973,1972,1971,1970,1969,1968,1967,1966,1965,1964,1963,1962,1961
This statistics in other country:
AfghanistanAlbaniaAlgeriaAmerican SamoaAngolaAntigua and BarbudaArab WorldArgentinaArmeniaArubaAustraliaAustriaAzerbaijanBahamas, TheBahrainBangladeshBarbadosBelarusBelgiumBelizeBeninBermudaBhutanBoliviaBosnia and HerzegovinaBotswanaBrazilBrunei DarussalamBulgariaBurkina FasoBurundiCabo VerdeCambodiaCameroonCanadaCaribbean small statesCentral African RepublicCentral Europe and the BalticsChadChileChinaColombiaComorosCongo, Dem. Rep.Congo, Rep.Costa RicaCote d'IvoireCroatiaCubaCuracaoCyprusCzech RepublicDenmarkDjiboutiDominicaDominican RepublicEarly-demographic dividendEast Asia & PacificEast Asia & Pacific (excluding high income)East Asia & Pacific (IDA & IBRD countries)EcuadorEgypt, Arab Rep.El SalvadorEquatorial GuineaEritreaEstoniaEthiopiaEuro areaEurope & Central AsiaEurope & Central Asia (excluding high income)Europe & Central Asia (IDA & IBRD countries)European UnionFaroe IslandsFijiFinlandFragile and conflict affected situationsFranceFrench PolynesiaGabonGambia, TheGeorgiaGermanyGhanaGreeceGreenlandGrenadaGuatemalaGuineaGuinea-BissauGuyanaHaitiHeavily indebted poor countries (HIPC)High incomeHondurasHong Kong SAR, ChinaHungaryIBRD onlyIcelandIDA & IBRD totalIDA blendIDA onlyIDA totalIndiaIndonesiaIran, Islamic Rep.IraqIrelandIsraelItalyJamaicaJapanJordanKazakhstanKenyaKiribatiKorea, Dem. People’s Rep.Korea, Rep.KuwaitKyrgyz RepublicLao PDRLate-demographic dividendLatin America & Caribbean Latin America & Caribbean (excluding high income)Latin America & the Caribbean (IDA & IBRD countries)LatviaLeast developed countries: UN classificationLebanonLesothoLiberiaLibyaLithuaniaLow & middle incomeLow incomeLower middle incomeLuxembourgMacao SAR, ChinaMacedonia, FYRMadagascarMalawiMalaysiaMaldivesMaliMaltaMarshall IslandsMauritaniaMauritiusMexicoMicronesia, Fed. Sts.Middle East & North AfricaMiddle East & North Africa (excluding high income)Middle East & North Africa (IDA & IBRD countries)Middle incomeMoldovaMongoliaMontenegroMoroccoMozambiqueMyanmarNamibiaNepalNetherlandsNew CaledoniaNew ZealandNicaraguaNigerNigeriaNorth AmericaNorthern Mariana IslandsNorwayOECD membersOmanOther small statesPacific island small statesPakistanPalauPanamaPapua New GuineaParaguayPeruPhilippinesPolandPortugalPost-demographic dividendPre-demographic dividendQatarRomaniaRussian FederationRwandaSamoaSao Tome and PrincipeSaudi ArabiaSenegalSerbiaSeychellesSierra LeoneSingaporeSint Maarten (Dutch part)Slovak RepublicSloveniaSmall statesSolomon IslandsSouth AfricaSouth AsiaSouth Asia (IDA & IBRD)SpainSri LankaSt. Kitts and NevisSt. LuciaSt. Martin (French part)St. Vincent and the GrenadinesSub-Saharan Africa Sub-Saharan Africa (excluding high income)Sub-Saharan Africa (IDA & IBRD countries)SudanSurinameSwazilandSwedenSwitzerlandSyrian Arab RepublicTajikistanTanzaniaThailandTimor-LesteTogoTongaTrinidad and TobagoTunisiaTurkeyTurkmenistanTuvaluUgandaUkraineUnited Arab EmiratesUnited KingdomUnited StatesUpper middle incomeUruguayUzbekistanVanuatuVenezuela, RBVietnamWorldYemen, Rep.ZambiaZimbabwe Timeline:
This timeline shows a graph from 1961 to 2016 of Late-demographic dividend. No data until 1960. Number of actual observations by date: 56.
Source name:
World Development Indicators
Source organization:
World Trade Organization.
Categories, topics:
Private Sector, Trade
Last updated:
apr 23, 2017
Indicators value changes by year
Minimum:
15.314 bln
jan 1, 1962
Maximum:
4.47 trl
jan 1, 2014
At the date of observation
Value
Absolute change
Change from previous value
jan 1, 1961
15.487 bln
+15.487 bln
0.0%
jan 1, 1962
15.314 bln
-173.447 mln
-1.12%
jan 1, 1963
15.372 bln
+58.093 mln
0.38%
jan 1, 1964
16.023 bln
+650.417 mln
4.23%
jan 1, 1965
17.475 bln
+1.452 bln
9.06%
jan 1, 1966
18.39 bln
+915.592 mln
5.24%
jan 1, 1967
20.758 bln
+2.367 bln
12.87%
jan 1, 1968
21.462 bln
+704.629 mln
3.39%
jan 1, 1969
22.825 bln
+1.363 bln
6.35%
jan 1, 1970
24.951 bln
+2.125 bln
9.31%
jan 1, 1971
28.402 bln
+3.451 bln
13.83%
jan 1, 1972
31.814 bln
+3.413 bln
12.02%
jan 1, 1973
38.05 bln
+6.235 bln
19.6%
jan 1, 1974
53.836 bln
+15.787 bln
41.49%
jan 1, 1975
86.316 bln
+32.479 bln
60.33%
jan 1, 1976
92.637 bln
+6.321 bln
7.32%
jan 1, 1977
97.479 bln
+4.842 bln
5.23%
jan 1, 1978
112.776 bln
+15.296 bln
15.69%
jan 1, 1979
130.801 bln
+18.025 bln
15.98%
jan 1, 1980
165.562 bln
+34.761 bln
26.58%
jan 1, 1981
205.722 bln
+40.16 bln
24.26%
jan 1, 1982
204.007 bln
-1.714 bln
-0.83%
jan 1, 1983
183.878 bln
-20.129 bln
-9.87%
jan 1, 1984
175.064 bln
-8.814 bln
-4.79%
jan 1, 1985
178.458 bln
+3.394 bln
1.94%
jan 1, 1986
188.345 bln
+9.887 bln
5.54%
jan 1, 1987
190.997 bln
+2.652 bln
1.41%
jan 1, 1988
206.61 bln
+15.613 bln
8.17%
jan 1, 1989
246.038 bln
+39.429 bln
19.08%
jan 1, 1990
277.643 bln
+31.605 bln
12.85%
jan 1, 1991
302.986 bln
+25.343 bln
9.13%
jan 1, 1992
342.651 bln
+39.665 bln
13.09%
jan 1, 1993
388.284 bln
+45.633 bln
13.32%
jan 1, 1994
446.861 bln
+58.577 bln
15.09%
jan 1, 1995
518.36 bln
+71.499 bln
16.0%
jan 1, 1996
642.907 bln
+124.547 bln
24.03%
jan 1, 1997
697.143 bln
+54.236 bln
8.44%
jan 1, 1998
724.557 bln
+27.414 bln
3.93%
jan 1, 1999
675.068 bln
-49.489 bln
-6.83%
jan 1, 2000
670.886 bln
-4.183 bln
-0.62%
jan 1, 2001
805.918 bln
+135.032 bln
20.13%
jan 1, 2002
838.377 bln
+32.459 bln
4.03%
jan 1, 2003
923.134 bln
+84.756 bln
10.11%
jan 1, 2004
1.142 trl
+218.894 bln
23.71%
jan 1, 2005
1.488 trl
+345.977 bln
30.29%
jan 1, 2006
1.759 trl
+270.566 bln
18.18%
jan 1, 2007
2.11 trl
+351.352 bln
19.98%
jan 1, 2008
2.622 trl
+512.459 bln
24.29%
jan 1, 2009
3.214 trl
+591.834 bln
22.57%
jan 1, 2010
2.556 trl
-658.185 bln
-20.48%
jan 1, 2011
3.293 trl
+736.563 bln
28.82%
jan 1, 2012
4.085 trl
+792.118 bln
24.06%
jan 1, 2013
4.237 trl
+151.976 bln
3.72%
jan 1, 2014
4.47 trl
+232.911 bln
5.5%
jan 1, 2015
4.456 trl
-14.052 bln
-0.31%
jan 1, 2016
3.79 trl
-665.762 bln
-14.94%
Ranking of countries by current statistics by years


Comments: