29
/
en
AIzaSyAYiBZKx7MnpbEhh9jyipgxe19OcubqV5w
April 1, 2024
53580
Other small states
OSS
false
2
1
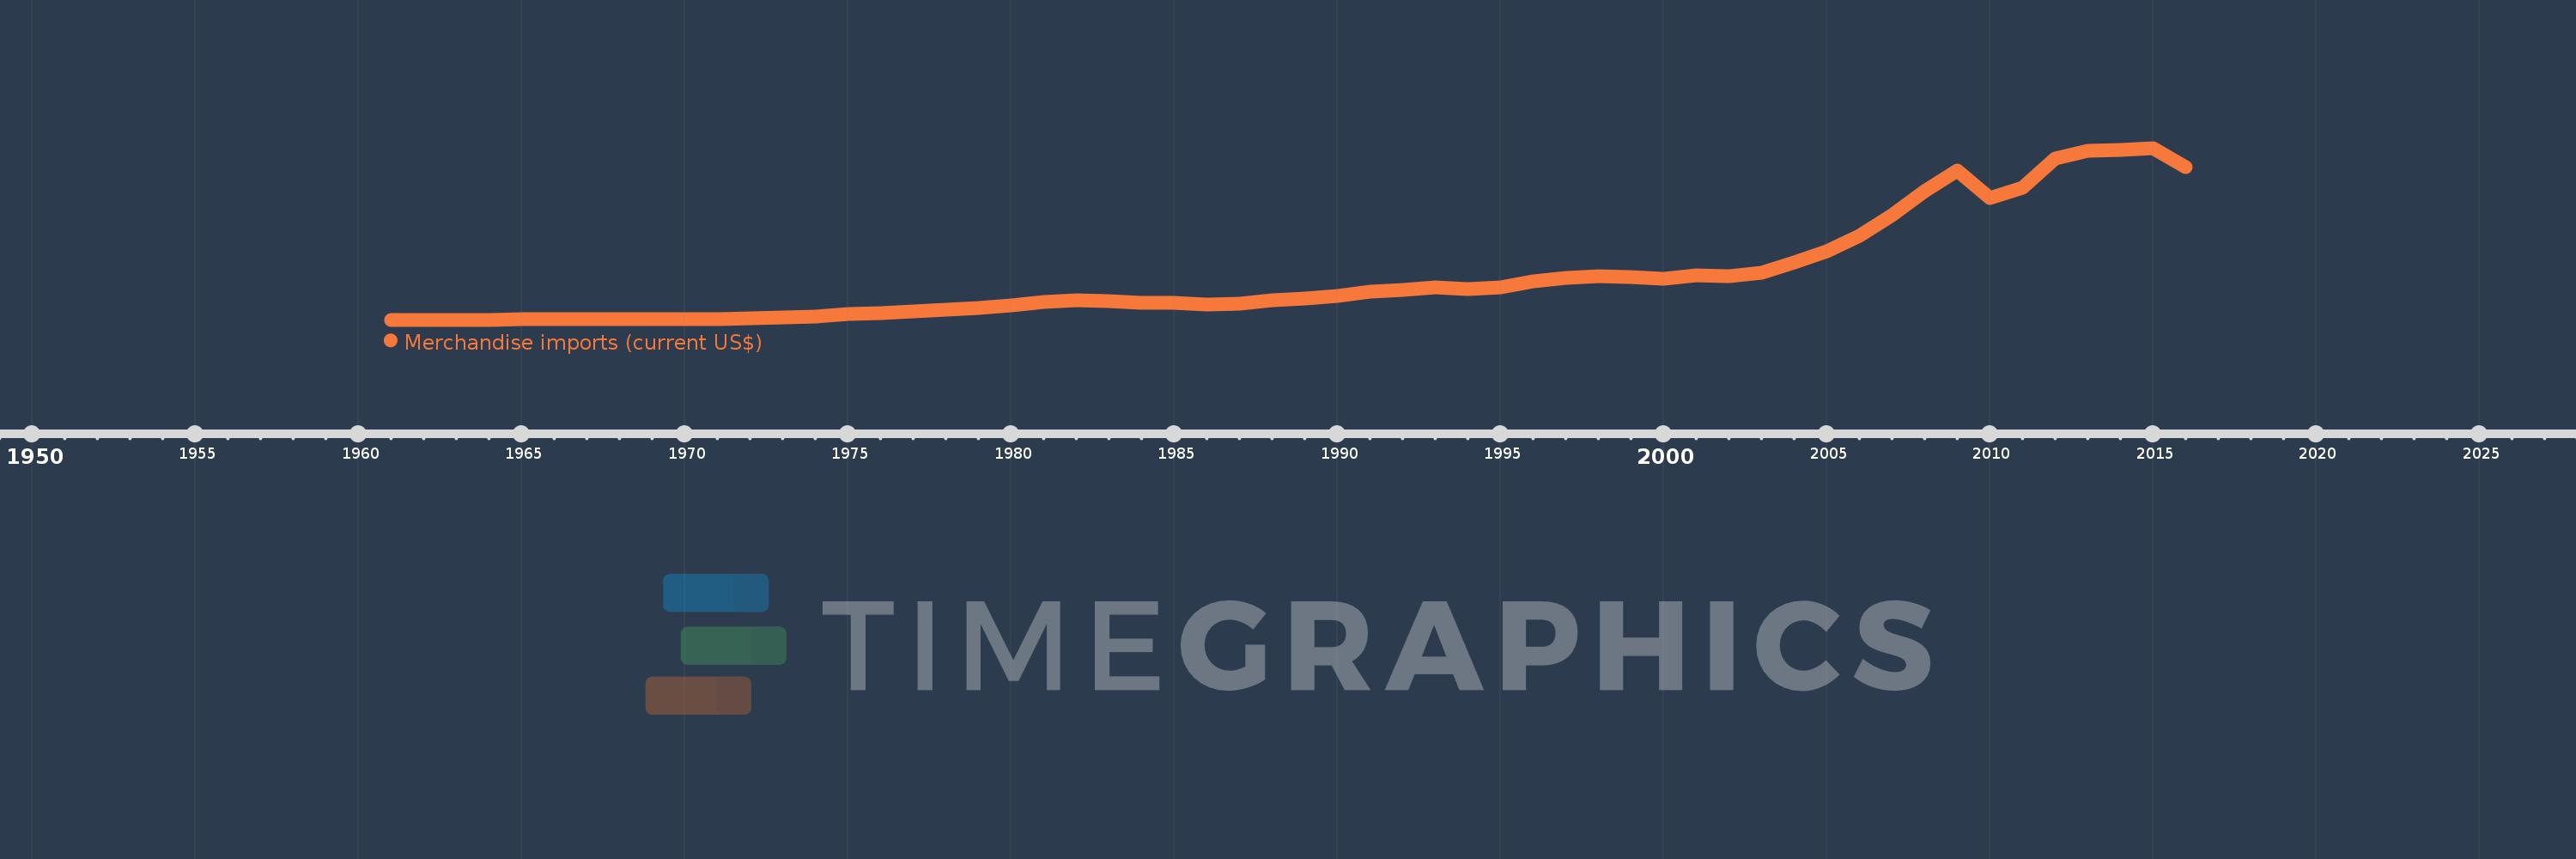
Merchandise imports (current US$)
2016,2015,2014,2013,2012,2011,2010,2009,2008,2007,2006,2005,2004,2003,2002,2001,2000,1999,1998,1997,1996,1995,1994,1993,1992,1991,1990,1989,1988,1987,1986,1985,1984,1983,1982,1981,1980,1979,1978,1977,1976,1975,1974,1973,1972,1971,1970,1969,1968,1967,1966,1965,1964,1963,1962,1961
This statistics in other country:
AfghanistanAlbaniaAlgeriaAmerican SamoaAngolaAntigua and BarbudaArab WorldArgentinaArmeniaArubaAustraliaAustriaAzerbaijanBahamas, TheBahrainBangladeshBarbadosBelarusBelgiumBelizeBeninBermudaBhutanBoliviaBosnia and HerzegovinaBotswanaBrazilBrunei DarussalamBulgariaBurkina FasoBurundiCabo VerdeCambodiaCameroonCanadaCaribbean small statesCentral African RepublicCentral Europe and the BalticsChadChileChinaColombiaComorosCongo, Dem. Rep.Congo, Rep.Costa RicaCote d'IvoireCroatiaCubaCuracaoCyprusCzech RepublicDenmarkDjiboutiDominicaDominican RepublicEarly-demographic dividendEast Asia & PacificEast Asia & Pacific (excluding high income)East Asia & Pacific (IDA & IBRD countries)EcuadorEgypt, Arab Rep.El SalvadorEquatorial GuineaEritreaEstoniaEthiopiaEuro areaEurope & Central AsiaEurope & Central Asia (excluding high income)Europe & Central Asia (IDA & IBRD countries)European UnionFaroe IslandsFijiFinlandFragile and conflict affected situationsFranceFrench PolynesiaGabonGambia, TheGeorgiaGermanyGhanaGreeceGreenlandGrenadaGuatemalaGuineaGuinea-BissauGuyanaHaitiHeavily indebted poor countries (HIPC)High incomeHondurasHong Kong SAR, ChinaHungaryIBRD onlyIcelandIDA & IBRD totalIDA blendIDA onlyIDA totalIndiaIndonesiaIran, Islamic Rep.IraqIrelandIsraelItalyJamaicaJapanJordanKazakhstanKenyaKiribatiKorea, Dem. People’s Rep.Korea, Rep.KuwaitKyrgyz RepublicLao PDRLate-demographic dividendLatin America & Caribbean Latin America & Caribbean (excluding high income)Latin America & the Caribbean (IDA & IBRD countries)LatviaLeast developed countries: UN classificationLebanonLesothoLiberiaLibyaLithuaniaLow & middle incomeLow incomeLower middle incomeLuxembourgMacao SAR, ChinaMacedonia, FYRMadagascarMalawiMalaysiaMaldivesMaliMaltaMarshall IslandsMauritaniaMauritiusMexicoMicronesia, Fed. Sts.Middle East & North AfricaMiddle East & North Africa (excluding high income)Middle East & North Africa (IDA & IBRD countries)Middle incomeMoldovaMongoliaMontenegroMoroccoMozambiqueMyanmarNamibiaNepalNetherlandsNew CaledoniaNew ZealandNicaraguaNigerNigeriaNorth AmericaNorthern Mariana IslandsNorwayOECD membersOmanOther small statesPacific island small statesPakistanPalauPanamaPapua New GuineaParaguayPeruPhilippinesPolandPortugalPost-demographic dividendPre-demographic dividendQatarRomaniaRussian FederationRwandaSamoaSao Tome and PrincipeSaudi ArabiaSenegalSerbiaSeychellesSierra LeoneSingaporeSint Maarten (Dutch part)Slovak RepublicSloveniaSmall statesSolomon IslandsSouth AfricaSouth AsiaSouth Asia (IDA & IBRD)SpainSri LankaSt. Kitts and NevisSt. LuciaSt. Martin (French part)St. Vincent and the GrenadinesSub-Saharan Africa Sub-Saharan Africa (excluding high income)Sub-Saharan Africa (IDA & IBRD countries)SudanSurinameSwazilandSwedenSwitzerlandSyrian Arab RepublicTajikistanTanzaniaThailandTimor-LesteTogoTongaTrinidad and TobagoTunisiaTurkeyTurkmenistanTuvaluUgandaUkraineUnited Arab EmiratesUnited KingdomUnited StatesUpper middle incomeUruguayUzbekistanVanuatuVenezuela, RBVietnamWorldYemen, Rep.ZambiaZimbabwe Timeline:
This timeline shows a graph from 1961 to 2016 of Other small states. No data until 1960. Number of actual observations by date: 56.
Source name:
World Development Indicators
Source organization:
World Trade Organization.
Categories, topics:
Private Sector, Trade
Last updated:
apr 23, 2017
Indicators value changes by year
Minimum:
941.078 mln
jan 1, 1961
Maximum:
138.89 bln
jan 1, 2015
At the date of observation
Value
Absolute change
Change from previous value
jan 1, 1961
941.078 mln
+941.078 mln
0.0%
jan 1, 1962
954.713 mln
+13.635 mln
1.45%
jan 1, 1963
1.021 bln
+65.938 mln
6.91%
jan 1, 1964
1.076 bln
+55.038 mln
5.39%
jan 1, 1965
1.135 bln
+59.675 mln
5.55%
jan 1, 1966
1.246 bln
+110.156 mln
9.7%
jan 1, 1967
1.35 bln
+104.445 mln
8.39%
jan 1, 1968
1.452 bln
+102.339 mln
7.58%
jan 1, 1969
1.399 bln
-52.983 mln
-3.65%
jan 1, 1970
1.542 bln
+142.199 mln
10.16%
jan 1, 1971
1.748 bln
+206.9 mln
13.42%
jan 1, 1972
2.361 bln
+612.349 mln
35.02%
jan 1, 1973
2.549 bln
+187.913 mln
7.96%
jan 1, 1974
3.567 bln
+1.018 bln
39.96%
jan 1, 1975
5.343 bln
+1.776 bln
49.79%
jan 1, 1976
5.964 bln
+620.822 mln
11.62%
jan 1, 1977
7.345 bln
+1.381 bln
23.16%
jan 1, 1978
9.354 bln
+2.009 bln
27.36%
jan 1, 1979
10.084 bln
+730.391 mln
7.81%
jan 1, 1980
12.355 bln
+2.27 bln
22.51%
jan 1, 1981
15.456 bln
+3.102 bln
25.11%
jan 1, 1982
16.585 bln
+1.128 bln
7.3%
jan 1, 1983
16.035 bln
-549.413 mln
-3.31%
jan 1, 1984
14.637 bln
-1.398 bln
-8.72%
jan 1, 1985
14.251 bln
-386.75 mln
-2.64%
jan 1, 1986
13.329 bln
-921.375 mln
-6.47%
jan 1, 1987
13.752 bln
+423.15 mln
3.17%
jan 1, 1988
16.395 bln
+2.642 bln
19.21%
jan 1, 1989
18.258 bln
+1.863 bln
11.36%
jan 1, 1990
19.971 bln
+1.713 bln
9.38%
jan 1, 1991
23.619 bln
+3.648 bln
18.27%
jan 1, 1992
24.835 bln
+1.216 bln
5.15%
jan 1, 1993
26.994 bln
+2.159 bln
8.69%
jan 1, 1994
25.46 bln
-1.534 bln
-5.68%
jan 1, 1995
26.651 bln
+1.191 bln
4.68%
jan 1, 1996
32.044 bln
+5.393 bln
20.24%
jan 1, 1997
34.466 bln
+2.423 bln
7.56%
jan 1, 1998
35.866 bln
+1.399 bln
4.06%
jan 1, 1999
35.299 bln
-566.84 mln
-1.58%
jan 1, 2000
33.654 bln
-1.644 bln
-4.66%
jan 1, 2001
36.693 bln
+3.039 bln
9.03%
jan 1, 2002
36.094 bln
-598.363 mln
-1.63%
jan 1, 2003
38.423 bln
+2.329 bln
6.45%
jan 1, 2004
46.715 bln
+8.292 bln
21.58%
jan 1, 2005
56.105 bln
+9.39 bln
20.1%
jan 1, 2006
68.096 bln
+11.99 bln
21.37%
jan 1, 2007
84.599 bln
+16.503 bln
24.24%
jan 1, 2008
103.852 bln
+19.252 bln
22.76%
jan 1, 2009
120.934 bln
+17.083 bln
16.45%
jan 1, 2010
98.55 bln
-22.384 bln
-18.51%
jan 1, 2011
106.893 bln
+8.343 bln
8.47%
jan 1, 2012
130.487 bln
+23.594 bln
22.07%
jan 1, 2013
136.56 bln
+6.073 bln
4.65%
jan 1, 2014
137.152 bln
+591.676 mln
0.43%
jan 1, 2015
138.89 bln
+1.738 bln
1.27%
jan 1, 2016
123.239 bln
-15.651 bln
-11.27%
Ranking of countries by current statistics by years


Comments: