29
/
en
AIzaSyAYiBZKx7MnpbEhh9jyipgxe19OcubqV5w
April 1, 2024
194518
Mauritius
MUS
true
2
1
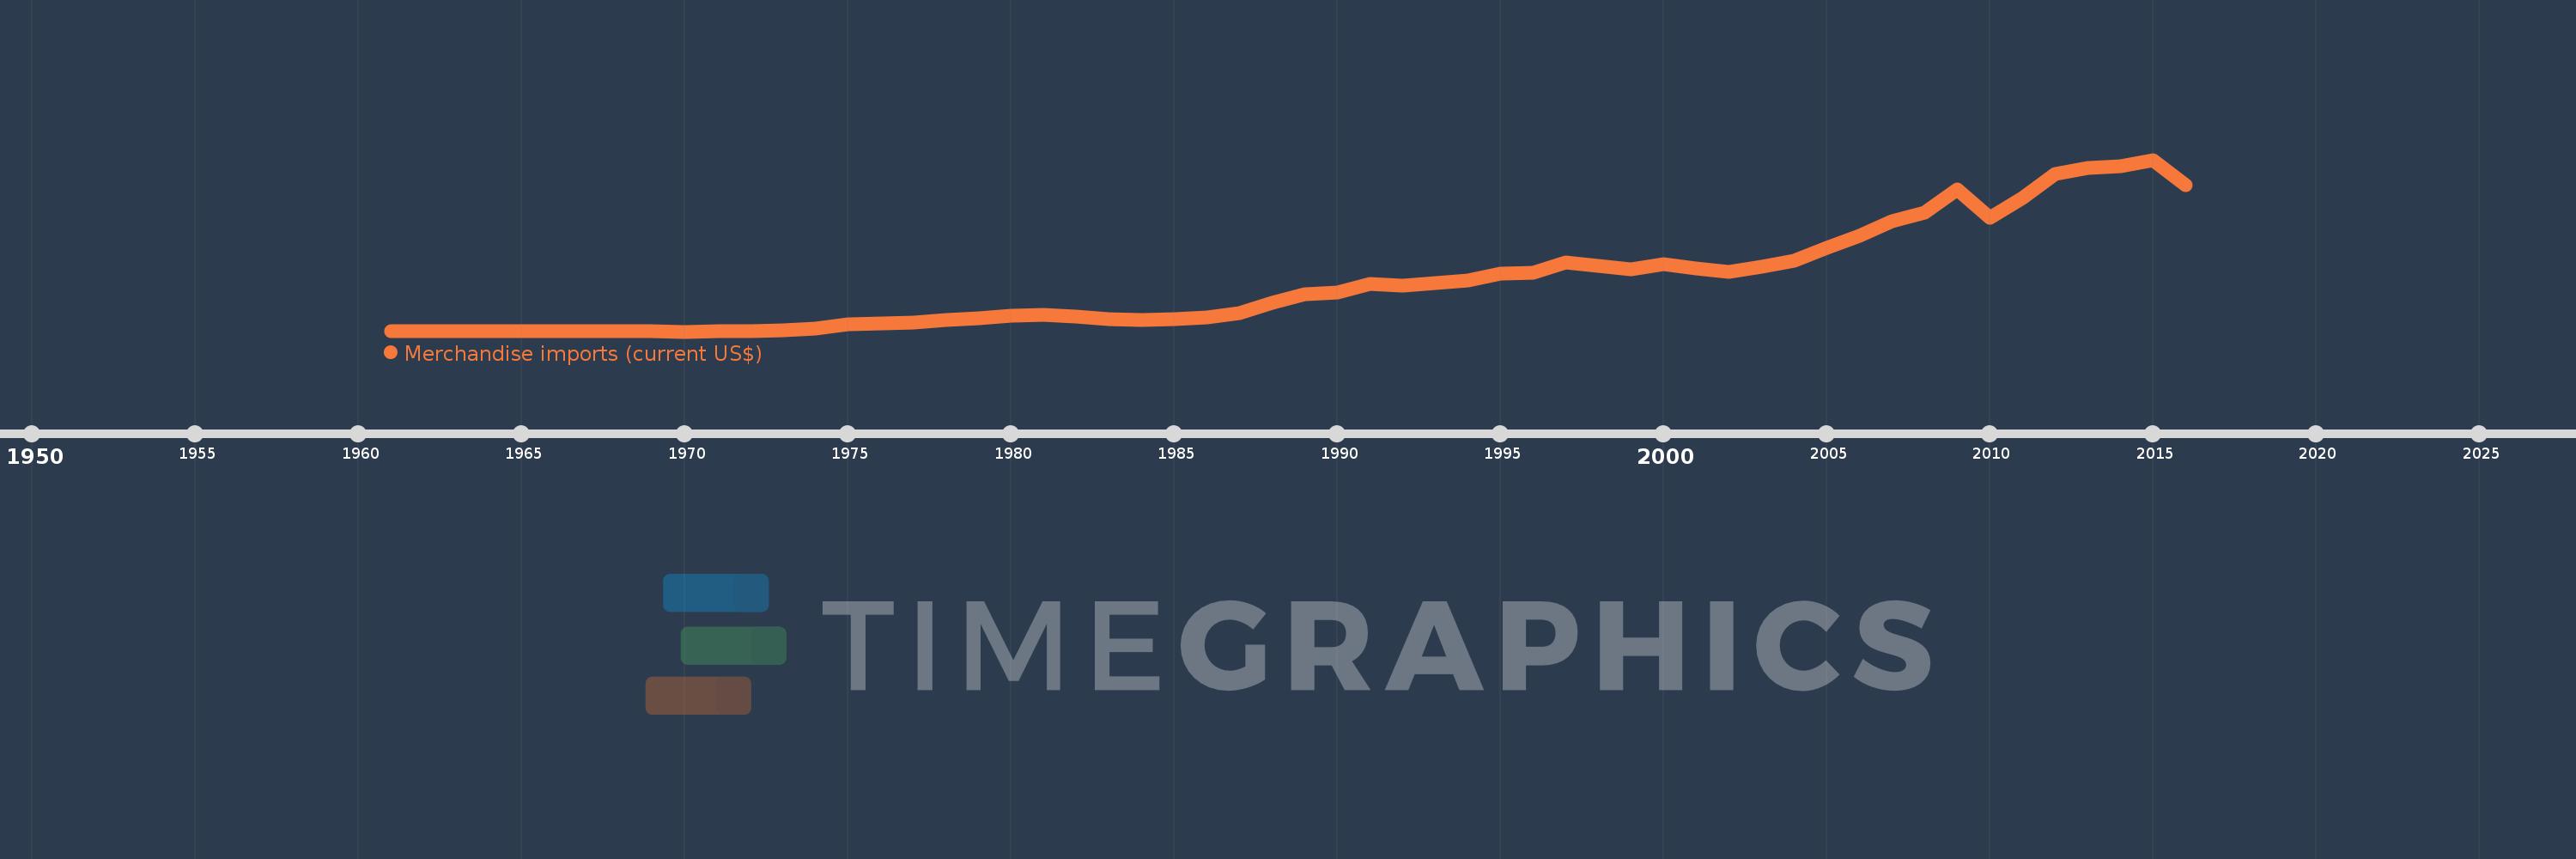
Merchandise imports (current US$)
2016,2015,2014,2013,2012,2011,2010,2009,2008,2007,2006,2005,2004,2003,2002,2001,2000,1999,1998,1997,1996,1995,1994,1993,1992,1991,1990,1989,1988,1987,1986,1985,1984,1983,1982,1981,1980,1979,1978,1977,1976,1975,1974,1973,1972,1971,1970,1969,1968,1967,1966,1965,1964,1963,1962,1961
This statistics in other country:
AfghanistanAlbaniaAlgeriaAmerican SamoaAngolaAntigua and BarbudaArab WorldArgentinaArmeniaArubaAustraliaAustriaAzerbaijanBahamas, TheBahrainBangladeshBarbadosBelarusBelgiumBelizeBeninBermudaBhutanBoliviaBosnia and HerzegovinaBotswanaBrazilBrunei DarussalamBulgariaBurkina FasoBurundiCabo VerdeCambodiaCameroonCanadaCaribbean small statesCentral African RepublicCentral Europe and the BalticsChadChileChinaColombiaComorosCongo, Dem. Rep.Congo, Rep.Costa RicaCote d'IvoireCroatiaCubaCuracaoCyprusCzech RepublicDenmarkDjiboutiDominicaDominican RepublicEarly-demographic dividendEast Asia & PacificEast Asia & Pacific (excluding high income)East Asia & Pacific (IDA & IBRD countries)EcuadorEgypt, Arab Rep.El SalvadorEquatorial GuineaEritreaEstoniaEthiopiaEuro areaEurope & Central AsiaEurope & Central Asia (excluding high income)Europe & Central Asia (IDA & IBRD countries)European UnionFaroe IslandsFijiFinlandFragile and conflict affected situationsFranceFrench PolynesiaGabonGambia, TheGeorgiaGermanyGhanaGreeceGreenlandGrenadaGuatemalaGuineaGuinea-BissauGuyanaHaitiHeavily indebted poor countries (HIPC)High incomeHondurasHong Kong SAR, ChinaHungaryIBRD onlyIcelandIDA & IBRD totalIDA blendIDA onlyIDA totalIndiaIndonesiaIran, Islamic Rep.IraqIrelandIsraelItalyJamaicaJapanJordanKazakhstanKenyaKiribatiKorea, Dem. People’s Rep.Korea, Rep.KuwaitKyrgyz RepublicLao PDRLate-demographic dividendLatin America & Caribbean Latin America & Caribbean (excluding high income)Latin America & the Caribbean (IDA & IBRD countries)LatviaLeast developed countries: UN classificationLebanonLesothoLiberiaLibyaLithuaniaLow & middle incomeLow incomeLower middle incomeLuxembourgMacao SAR, ChinaMacedonia, FYRMadagascarMalawiMalaysiaMaldivesMaliMaltaMarshall IslandsMauritaniaMauritiusMexicoMicronesia, Fed. Sts.Middle East & North AfricaMiddle East & North Africa (excluding high income)Middle East & North Africa (IDA & IBRD countries)Middle incomeMoldovaMongoliaMontenegroMoroccoMozambiqueMyanmarNamibiaNepalNetherlandsNew CaledoniaNew ZealandNicaraguaNigerNigeriaNorth AmericaNorthern Mariana IslandsNorwayOECD membersOmanOther small statesPacific island small statesPakistanPalauPanamaPapua New GuineaParaguayPeruPhilippinesPolandPortugalPost-demographic dividendPre-demographic dividendQatarRomaniaRussian FederationRwandaSamoaSao Tome and PrincipeSaudi ArabiaSenegalSerbiaSeychellesSierra LeoneSingaporeSint Maarten (Dutch part)Slovak RepublicSloveniaSmall statesSolomon IslandsSouth AfricaSouth AsiaSouth Asia (IDA & IBRD)SpainSri LankaSt. Kitts and NevisSt. LuciaSt. Martin (French part)St. Vincent and the GrenadinesSub-Saharan Africa Sub-Saharan Africa (excluding high income)Sub-Saharan Africa (IDA & IBRD countries)SudanSurinameSwazilandSwedenSwitzerlandSyrian Arab RepublicTajikistanTanzaniaThailandTimor-LesteTogoTongaTrinidad and TobagoTunisiaTurkeyTurkmenistanTuvaluUgandaUkraineUnited Arab EmiratesUnited KingdomUnited StatesUpper middle incomeUruguayUzbekistanVanuatuVenezuela, RBVietnamWorldYemen, Rep.ZambiaZimbabwe Timeline:
This timeline shows a graph from 1961 to 2016 of Mauritius. No data until 1960. Number of actual observations by date: 56.
Source name:
World Development Indicators
Source organization:
World Trade Organization.
Categories, topics:
Private Sector, Trade
Last updated:
apr 23, 2017
Indicators value changes by year
Minimum:
67.68 mln
jan 1, 1970
Maximum:
5.61 bln
jan 1, 2015
At the date of observation
Value
Absolute change
Change from previous value
jan 1, 1961
69.699 mln
+69.699 mln
0.0%
jan 1, 1962
68.04 mln
-1.659 mln
-2.38%
jan 1, 1963
67.767 mln
-273.0K
-0.4%
jan 1, 1964
69.951 mln
+2.184 mln
3.22%
jan 1, 1965
81.669 mln
+11.718 mln
16.75%
jan 1, 1966
77.133 mln
-4.536 mln
-5.55%
jan 1, 1967
69.972 mln
-7.161 mln
-9.28%
jan 1, 1968
77.001 mln
+7.029 mln
10.05%
jan 1, 1969
75.798 mln
-1.203 mln
-1.56%
jan 1, 1970
67.68 mln
-8.118 mln
-10.71%
jan 1, 1971
75.582 mln
+7.902 mln
11.68%
jan 1, 1972
84.106 mln
+8.524 mln
11.28%
jan 1, 1973
119.029 mln
+34.923 mln
41.52%
jan 1, 1974
168.297 mln
+49.268 mln
41.39%
jan 1, 1975
309.148 mln
+140.851 mln
83.69%
jan 1, 1976
331.806 mln
+22.658 mln
7.33%
jan 1, 1977
360.349 mln
+28.543 mln
8.6%
jan 1, 1978
446.793 mln
+86.444 mln
23.99%
jan 1, 1979
499.534 mln
+52.741 mln
11.8%
jan 1, 1980
573.874 mln
+74.34 mln
14.88%
jan 1, 1981
609.0 mln
+35.126 mln
6.12%
jan 1, 1982
563.0 mln
-46.0 mln
-7.55%
jan 1, 1983
464.0 mln
-99.0 mln
-17.58%
jan 1, 1984
441.0 mln
-23.0 mln
-4.96%
jan 1, 1985
471.0 mln
+30.0 mln
6.8%
jan 1, 1986
523.0 mln
+52.0 mln
11.04%
jan 1, 1987
676.0 mln
+153.0 mln
29.25%
jan 1, 1988
993.0 mln
+317.0 mln
46.89%
jan 1, 1989
1.261 bln
+268.0 mln
26.99%
jan 1, 1990
1.325 bln
+64.0 mln
5.08%
jan 1, 1991
1.618 bln
+293.0 mln
22.11%
jan 1, 1992
1.558 bln
-60.0 mln
-3.71%
jan 1, 1993
1.625 bln
+67.0 mln
4.3%
jan 1, 1994
1.715 bln
+90.0 mln
5.54%
jan 1, 1995
1.93 bln
+215.0 mln
12.54%
jan 1, 1996
1.976 bln
+46.0 mln
2.38%
jan 1, 1997
2.289 bln
+313.0 mln
15.84%
jan 1, 1998
2.189 bln
-100.0 mln
-4.37%
jan 1, 1999
2.073 bln
-116.0 mln
-5.3%
jan 1, 2000
2.247 bln
+174.0 mln
8.39%
jan 1, 2001
2.093 bln
-154.0 mln
-6.85%
jan 1, 2002
1.987 bln
-106.42 mln
-5.08%
jan 1, 2003
2.159 bln
+172.56 mln
8.69%
jan 1, 2004
2.363 bln
+204.24 mln
9.46%
jan 1, 2005
2.771 bln
+407.57 mln
17.25%
jan 1, 2006
3.157 bln
+386.05 mln
13.93%
jan 1, 2007
3.627 bln
+469.739 mln
14.88%
jan 1, 2008
3.894 bln
+266.895 mln
7.36%
jan 1, 2009
4.651 bln
+757.827 mln
19.46%
jan 1, 2010
3.733 bln
-918.735 mln
-19.75%
jan 1, 2011
4.386 bln
+652.931 mln
17.49%
jan 1, 2012
5.149 bln
+763.149 mln
17.4%
jan 1, 2013
5.354 bln
+205.465 mln
3.99%
jan 1, 2014
5.397 bln
+42.836 mln
0.8%
jan 1, 2015
5.61 bln
+213.159 mln
3.95%
jan 1, 2016
4.792 bln
-818.411 mln
-14.59%
Ranking of countries by current statistics by years


Comments: