29
/
en
AIzaSyAYiBZKx7MnpbEhh9jyipgxe19OcubqV5w
April 1, 2024
234883
Saudi Arabia
SAU
true
2
1
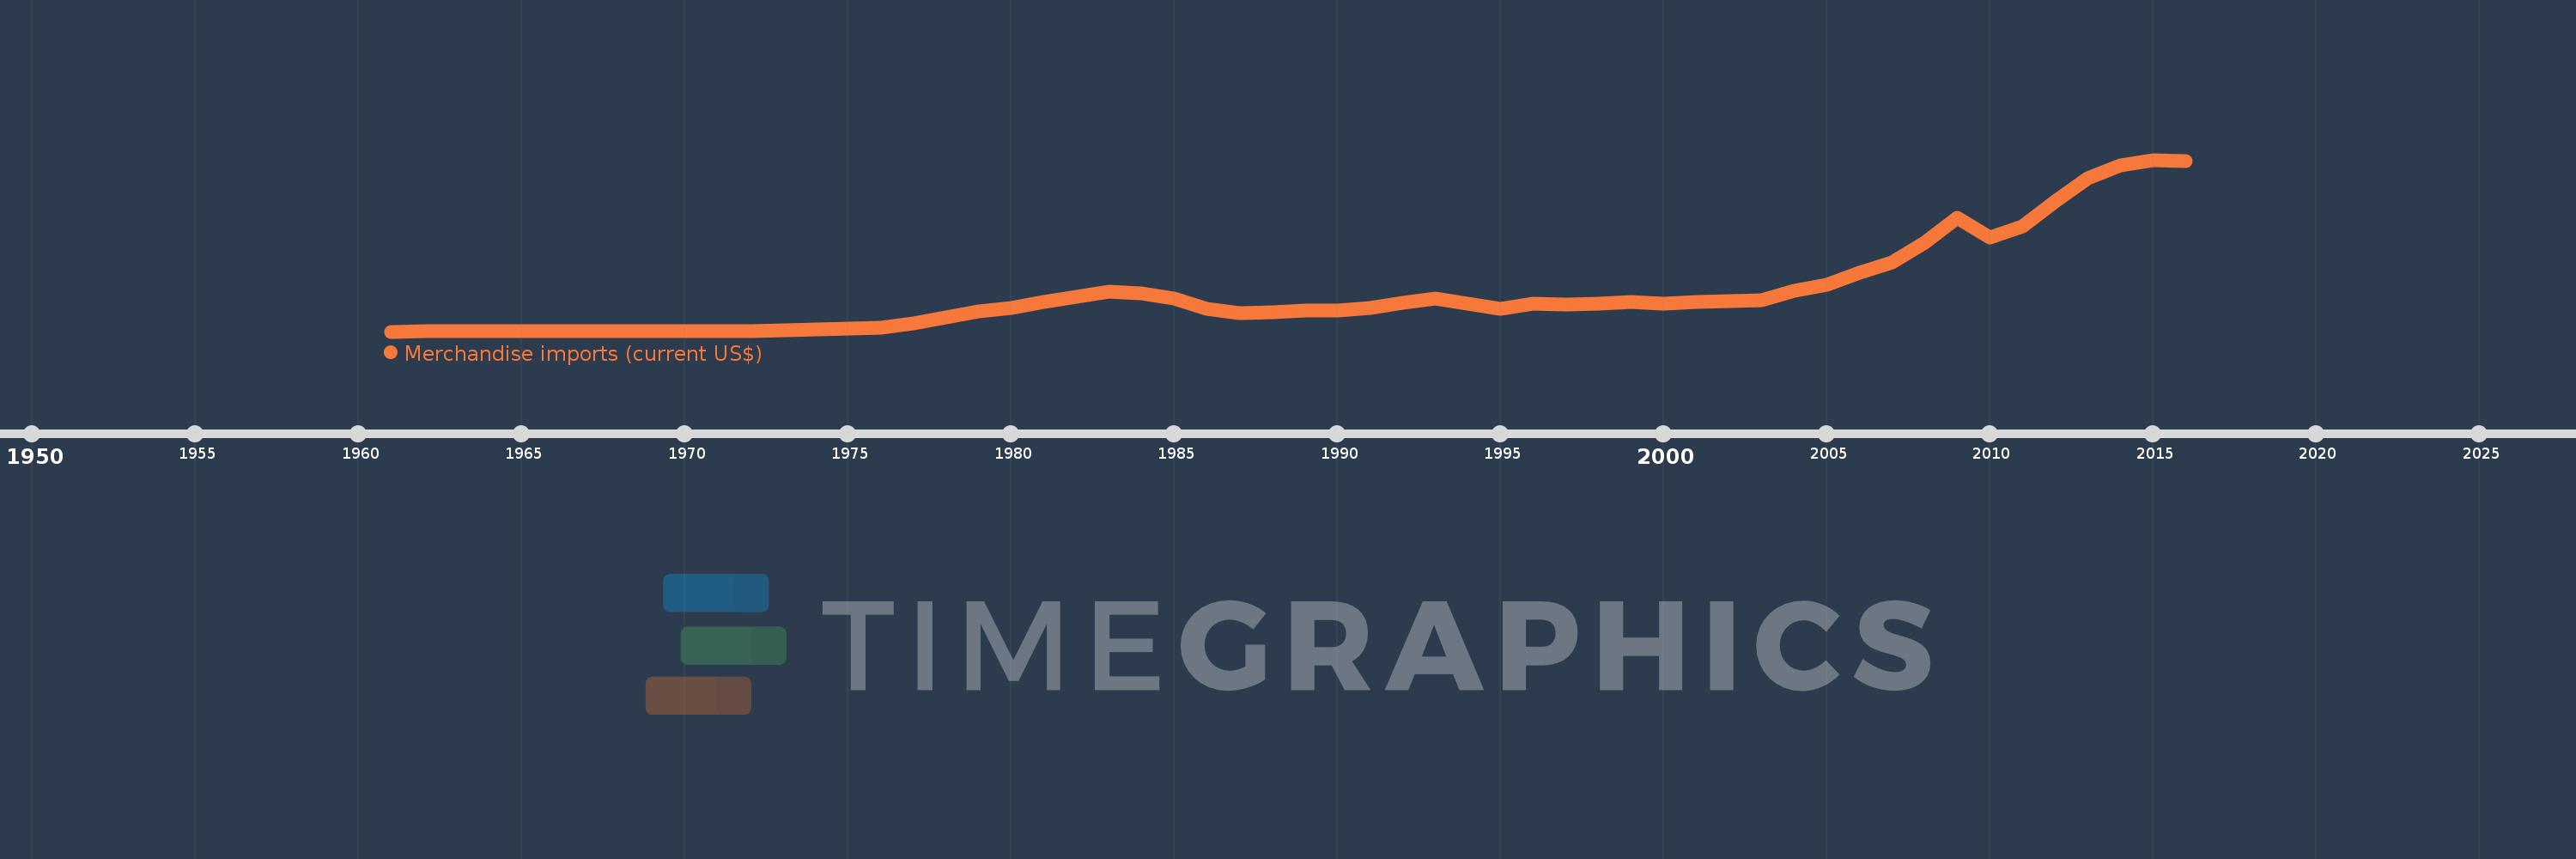
Merchandise imports (current US$)
2016,2015,2014,2013,2012,2011,2010,2009,2008,2007,2006,2005,2004,2003,2002,2001,2000,1999,1998,1997,1996,1995,1994,1993,1992,1991,1990,1989,1988,1987,1986,1985,1984,1983,1982,1981,1980,1979,1978,1977,1976,1975,1974,1973,1972,1971,1970,1969,1968,1967,1966,1965,1964,1963,1962,1961
This statistics in other country:
AfghanistanAlbaniaAlgeriaAmerican SamoaAngolaAntigua and BarbudaArab WorldArgentinaArmeniaArubaAustraliaAustriaAzerbaijanBahamas, TheBahrainBangladeshBarbadosBelarusBelgiumBelizeBeninBermudaBhutanBoliviaBosnia and HerzegovinaBotswanaBrazilBrunei DarussalamBulgariaBurkina FasoBurundiCabo VerdeCambodiaCameroonCanadaCaribbean small statesCentral African RepublicCentral Europe and the BalticsChadChileChinaColombiaComorosCongo, Dem. Rep.Congo, Rep.Costa RicaCote d'IvoireCroatiaCubaCuracaoCyprusCzech RepublicDenmarkDjiboutiDominicaDominican RepublicEarly-demographic dividendEast Asia & PacificEast Asia & Pacific (excluding high income)East Asia & Pacific (IDA & IBRD countries)EcuadorEgypt, Arab Rep.El SalvadorEquatorial GuineaEritreaEstoniaEthiopiaEuro areaEurope & Central AsiaEurope & Central Asia (excluding high income)Europe & Central Asia (IDA & IBRD countries)European UnionFaroe IslandsFijiFinlandFragile and conflict affected situationsFranceFrench PolynesiaGabonGambia, TheGeorgiaGermanyGhanaGreeceGreenlandGrenadaGuatemalaGuineaGuinea-BissauGuyanaHaitiHeavily indebted poor countries (HIPC)High incomeHondurasHong Kong SAR, ChinaHungaryIBRD onlyIcelandIDA & IBRD totalIDA blendIDA onlyIDA totalIndiaIndonesiaIran, Islamic Rep.IraqIrelandIsraelItalyJamaicaJapanJordanKazakhstanKenyaKiribatiKorea, Dem. People’s Rep.Korea, Rep.KuwaitKyrgyz RepublicLao PDRLate-demographic dividendLatin America & Caribbean Latin America & Caribbean (excluding high income)Latin America & the Caribbean (IDA & IBRD countries)LatviaLeast developed countries: UN classificationLebanonLesothoLiberiaLibyaLithuaniaLow & middle incomeLow incomeLower middle incomeLuxembourgMacao SAR, ChinaMacedonia, FYRMadagascarMalawiMalaysiaMaldivesMaliMaltaMarshall IslandsMauritaniaMauritiusMexicoMicronesia, Fed. Sts.Middle East & North AfricaMiddle East & North Africa (excluding high income)Middle East & North Africa (IDA & IBRD countries)Middle incomeMoldovaMongoliaMontenegroMoroccoMozambiqueMyanmarNamibiaNepalNetherlandsNew CaledoniaNew ZealandNicaraguaNigerNigeriaNorth AmericaNorthern Mariana IslandsNorwayOECD membersOmanOther small statesPacific island small statesPakistanPalauPanamaPapua New GuineaParaguayPeruPhilippinesPolandPortugalPost-demographic dividendPre-demographic dividendQatarRomaniaRussian FederationRwandaSamoaSao Tome and PrincipeSaudi ArabiaSenegalSerbiaSeychellesSierra LeoneSingaporeSint Maarten (Dutch part)Slovak RepublicSloveniaSmall statesSolomon IslandsSouth AfricaSouth AsiaSouth Asia (IDA & IBRD)SpainSri LankaSt. Kitts and NevisSt. LuciaSt. Martin (French part)St. Vincent and the GrenadinesSub-Saharan Africa Sub-Saharan Africa (excluding high income)Sub-Saharan Africa (IDA & IBRD countries)SudanSurinameSwazilandSwedenSwitzerlandSyrian Arab RepublicTajikistanTanzaniaThailandTimor-LesteTogoTongaTrinidad and TobagoTunisiaTurkeyTurkmenistanTuvaluUgandaUkraineUnited Arab EmiratesUnited KingdomUnited StatesUpper middle incomeUruguayUzbekistanVanuatuVenezuela, RBVietnamWorldYemen, Rep.ZambiaZimbabwe Timeline:
This timeline shows a graph from 1961 to 2016 of Saudi Arabia. No data until 1960. Number of actual observations by date: 56.
Source name:
World Development Indicators
Source organization:
World Trade Organization.
Categories, topics:
Private Sector, Trade
Last updated:
apr 23, 2017
Indicators value changes by year
Minimum:
234.0 mln
jan 1, 1961
Maximum:
173.834 bln
jan 1, 2015
At the date of observation
Value
Absolute change
Change from previous value
jan 1, 1961
234.0 mln
+234.0 mln
0.0%
jan 1, 1962
261.111 mln
+27.111 mln
11.59%
jan 1, 1963
308.0 mln
+46.889 mln
17.96%
jan 1, 1964
320.0 mln
+12.0 mln
3.9%
jan 1, 1965
394.0 mln
+74.0 mln
23.12%
jan 1, 1966
506.0 mln
+112.0 mln
28.43%
jan 1, 1967
592.0 mln
+86.0 mln
17.0%
jan 1, 1968
574.0 mln
-18.0 mln
-3.04%
jan 1, 1969
553.111 mln
-20.889 mln
-3.64%
jan 1, 1970
734.667 mln
+181.556 mln
32.82%
jan 1, 1971
692.889 mln
-41.778 mln
-5.69%
jan 1, 1972
808.091 mln
+115.202 mln
16.63%
jan 1, 1973
1.136 bln
+327.799 mln
40.56%
jan 1, 1974
1.972 bln
+836.27 mln
73.62%
jan 1, 1975
2.86 bln
+887.56 mln
45.0%
jan 1, 1976
4.213 bln
+1.353 bln
47.33%
jan 1, 1977
8.695 bln
+4.481 bln
106.37%
jan 1, 1978
14.656 bln
+5.961 bln
68.56%
jan 1, 1979
20.422 bln
+5.766 bln
39.34%
jan 1, 1980
24.462 bln
+4.04 bln
19.78%
jan 1, 1981
30.166 bln
+5.704 bln
23.32%
jan 1, 1982
35.269 bln
+5.103 bln
16.92%
jan 1, 1983
40.644 bln
+5.375 bln
15.24%
jan 1, 1984
39.197 bln
-1.447 bln
-3.56%
jan 1, 1985
33.696 bln
-5.501 bln
-14.03%
jan 1, 1986
23.622 bln
-10.074 bln
-29.9%
jan 1, 1987
19.112 bln
-4.51 bln
-19.09%
jan 1, 1988
20.11 bln
+998.0 mln
5.22%
jan 1, 1989
21.784 bln
+1.674 bln
8.32%
jan 1, 1990
21.154 bln
-630.0 mln
-2.89%
jan 1, 1991
24.069 bln
+2.915 bln
13.78%
jan 1, 1992
29.079 bln
+5.01 bln
20.82%
jan 1, 1993
33.698 bln
+4.619 bln
15.88%
jan 1, 1994
28.198 bln
-5.5 bln
-16.32%
jan 1, 1995
23.338 bln
-4.86 bln
-17.24%
jan 1, 1996
28.091 bln
+4.753 bln
20.37%
jan 1, 1997
27.744 bln
-347.0 mln
-1.24%
jan 1, 1998
28.732 bln
+988.0 mln
3.56%
jan 1, 1999
30.013 bln
+1.281 bln
4.46%
jan 1, 2000
28.011 bln
-2.002 bln
-6.67%
jan 1, 2001
30.238 bln
+2.227 bln
7.95%
jan 1, 2002
31.223 bln
+985.0 mln
3.26%
jan 1, 2003
32.293 bln
+1.07 bln
3.43%
jan 1, 2004
41.704 bln
+9.411 bln
29.14%
jan 1, 2005
47.376 bln
+5.671 bln
13.6%
jan 1, 2006
59.459 bln
+12.083 bln
25.5%
jan 1, 2007
69.8 bln
+10.341 bln
17.39%
jan 1, 2008
90.214 bln
+20.414 bln
29.25%
jan 1, 2009
115.134 bln
+24.92 bln
27.62%
jan 1, 2010
95.552 bln
-19.582 bln
-17.01%
jan 1, 2011
106.863 bln
+11.311 bln
11.84%
jan 1, 2012
131.586 bln
+24.723 bln
23.14%
jan 1, 2013
155.593 bln
+24.006 bln
18.24%
jan 1, 2014
168.155 bln
+12.562 bln
8.07%
jan 1, 2015
173.834 bln
+5.678 bln
3.38%
jan 1, 2016
172.252 bln
-1.582 bln
-0.91%
Ranking of countries by current statistics by years


Comments: