29
/
en
AIzaSyAYiBZKx7MnpbEhh9jyipgxe19OcubqV5w
April 1, 2024
25905
Central Europe and the Baltics
CEB
false
2
1
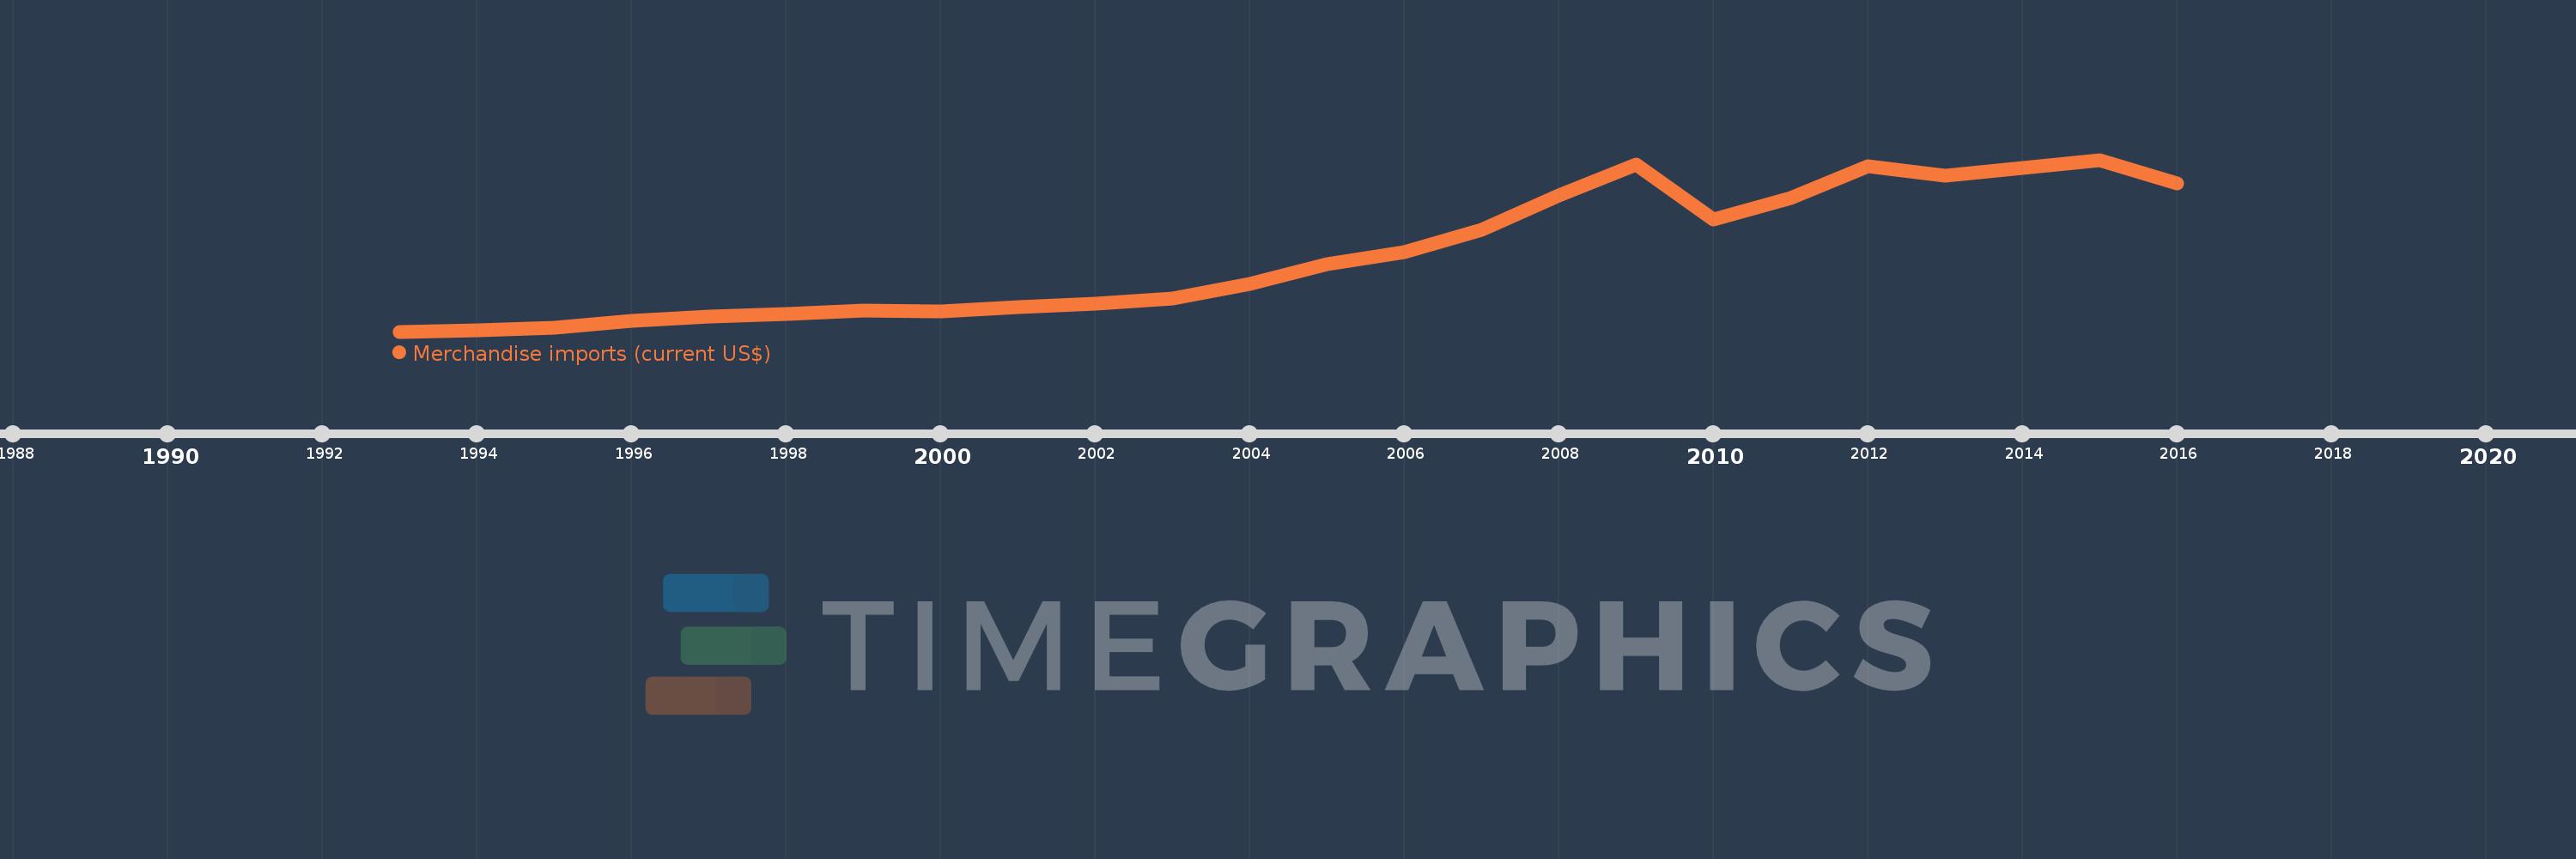
Merchandise imports (current US$)
2016,2015,2014,2013,2012,2011,2010,2009,2008,2007,2006,2005,2004,2003,2002,2001,2000,1999,1998,1997,1996,1995,1994,1993
This statistics in other country:
AfghanistanAlbaniaAlgeriaAmerican SamoaAngolaAntigua and BarbudaArab WorldArgentinaArmeniaArubaAustraliaAustriaAzerbaijanBahamas, TheBahrainBangladeshBarbadosBelarusBelgiumBelizeBeninBermudaBhutanBoliviaBosnia and HerzegovinaBotswanaBrazilBrunei DarussalamBulgariaBurkina FasoBurundiCabo VerdeCambodiaCameroonCanadaCaribbean small statesCentral African RepublicCentral Europe and the BalticsChadChileChinaColombiaComorosCongo, Dem. Rep.Congo, Rep.Costa RicaCote d'IvoireCroatiaCubaCuracaoCyprusCzech RepublicDenmarkDjiboutiDominicaDominican RepublicEarly-demographic dividendEast Asia & PacificEast Asia & Pacific (excluding high income)East Asia & Pacific (IDA & IBRD countries)EcuadorEgypt, Arab Rep.El SalvadorEquatorial GuineaEritreaEstoniaEthiopiaEuro areaEurope & Central AsiaEurope & Central Asia (excluding high income)Europe & Central Asia (IDA & IBRD countries)European UnionFaroe IslandsFijiFinlandFragile and conflict affected situationsFranceFrench PolynesiaGabonGambia, TheGeorgiaGermanyGhanaGreeceGreenlandGrenadaGuatemalaGuineaGuinea-BissauGuyanaHaitiHeavily indebted poor countries (HIPC)High incomeHondurasHong Kong SAR, ChinaHungaryIBRD onlyIcelandIDA & IBRD totalIDA blendIDA onlyIDA totalIndiaIndonesiaIran, Islamic Rep.IraqIrelandIsraelItalyJamaicaJapanJordanKazakhstanKenyaKiribatiKorea, Dem. People’s Rep.Korea, Rep.KuwaitKyrgyz RepublicLao PDRLate-demographic dividendLatin America & Caribbean Latin America & Caribbean (excluding high income)Latin America & the Caribbean (IDA & IBRD countries)LatviaLeast developed countries: UN classificationLebanonLesothoLiberiaLibyaLithuaniaLow & middle incomeLow incomeLower middle incomeLuxembourgMacao SAR, ChinaMacedonia, FYRMadagascarMalawiMalaysiaMaldivesMaliMaltaMarshall IslandsMauritaniaMauritiusMexicoMicronesia, Fed. Sts.Middle East & North AfricaMiddle East & North Africa (excluding high income)Middle East & North Africa (IDA & IBRD countries)Middle incomeMoldovaMongoliaMontenegroMoroccoMozambiqueMyanmarNamibiaNepalNetherlandsNew CaledoniaNew ZealandNicaraguaNigerNigeriaNorth AmericaNorthern Mariana IslandsNorwayOECD membersOmanOther small statesPacific island small statesPakistanPalauPanamaPapua New GuineaParaguayPeruPhilippinesPolandPortugalPost-demographic dividendPre-demographic dividendQatarRomaniaRussian FederationRwandaSamoaSao Tome and PrincipeSaudi ArabiaSenegalSerbiaSeychellesSierra LeoneSingaporeSint Maarten (Dutch part)Slovak RepublicSloveniaSmall statesSolomon IslandsSouth AfricaSouth AsiaSouth Asia (IDA & IBRD)SpainSri LankaSt. Kitts and NevisSt. LuciaSt. Martin (French part)St. Vincent and the GrenadinesSub-Saharan Africa Sub-Saharan Africa (excluding high income)Sub-Saharan Africa (IDA & IBRD countries)SudanSurinameSwazilandSwedenSwitzerlandSyrian Arab RepublicTajikistanTanzaniaThailandTimor-LesteTogoTongaTrinidad and TobagoTunisiaTurkeyTurkmenistanTuvaluUgandaUkraineUnited Arab EmiratesUnited KingdomUnited StatesUpper middle incomeUruguayUzbekistanVanuatuVenezuela, RBVietnamWorldYemen, Rep.ZambiaZimbabwe Timeline:
This timeline shows a graph from 1993 to 2016 of Central Europe and the Baltics. No data until 1992. Number of actual observations by date: 24.
Source name:
World Development Indicators
Source organization:
World Trade Organization.
Categories, topics:
Private Sector, Trade
Last updated:
apr 23, 2017
Indicators value changes by year
Minimum:
74.609 bln
jan 1, 1993
Maximum:
804.492 bln
jan 1, 2015
At the date of observation
Value
Absolute change
Change from previous value
jan 1, 1993
74.609 bln
+74.609 bln
0.0%
jan 1, 1994
80.951 bln
+6.342 bln
8.5%
jan 1, 1995
90.626 bln
+9.675 bln
11.95%
jan 1, 1996
119.163 bln
+28.537 bln
31.49%
jan 1, 1997
138.026 bln
+18.863 bln
15.83%
jan 1, 1998
149.845 bln
+11.82 bln
8.56%
jan 1, 1999
163.106 bln
+13.26 bln
8.85%
jan 1, 2000
159.374 bln
-3.731 bln
-2.29%
jan 1, 2001
177.371 bln
+17.996 bln
11.29%
jan 1, 2002
192.103 bln
+14.732 bln
8.31%
jan 1, 2003
215.366 bln
+23.263 bln
12.11%
jan 1, 2004
276.243 bln
+60.877 bln
28.27%
jan 1, 2005
359.374 bln
+83.131 bln
30.09%
jan 1, 2006
411.453 bln
+52.08 bln
14.49%
jan 1, 2007
507.839 bln
+96.385 bln
23.43%
jan 1, 2008
652.923 bln
+145.085 bln
28.57%
jan 1, 2009
785.686 bln
+132.763 bln
20.33%
jan 1, 2010
551.665 bln
-234.021 bln
-29.79%
jan 1, 2011
643.068 bln
+91.403 bln
16.57%
jan 1, 2012
777.784 bln
+134.715 bln
20.95%
jan 1, 2013
736.108 bln
-41.676 bln
-5.36%
jan 1, 2014
768.021 bln
+31.913 bln
4.34%
jan 1, 2015
804.492 bln
+36.471 bln
4.75%
jan 1, 2016
705.62 bln
-98.871 bln
-12.29%
Ranking of countries by current statistics by years


Comments: