29
/
en
AIzaSyAYiBZKx7MnpbEhh9jyipgxe19OcubqV5w
April 1, 2024
264874
Togo
TGO
true
2
1
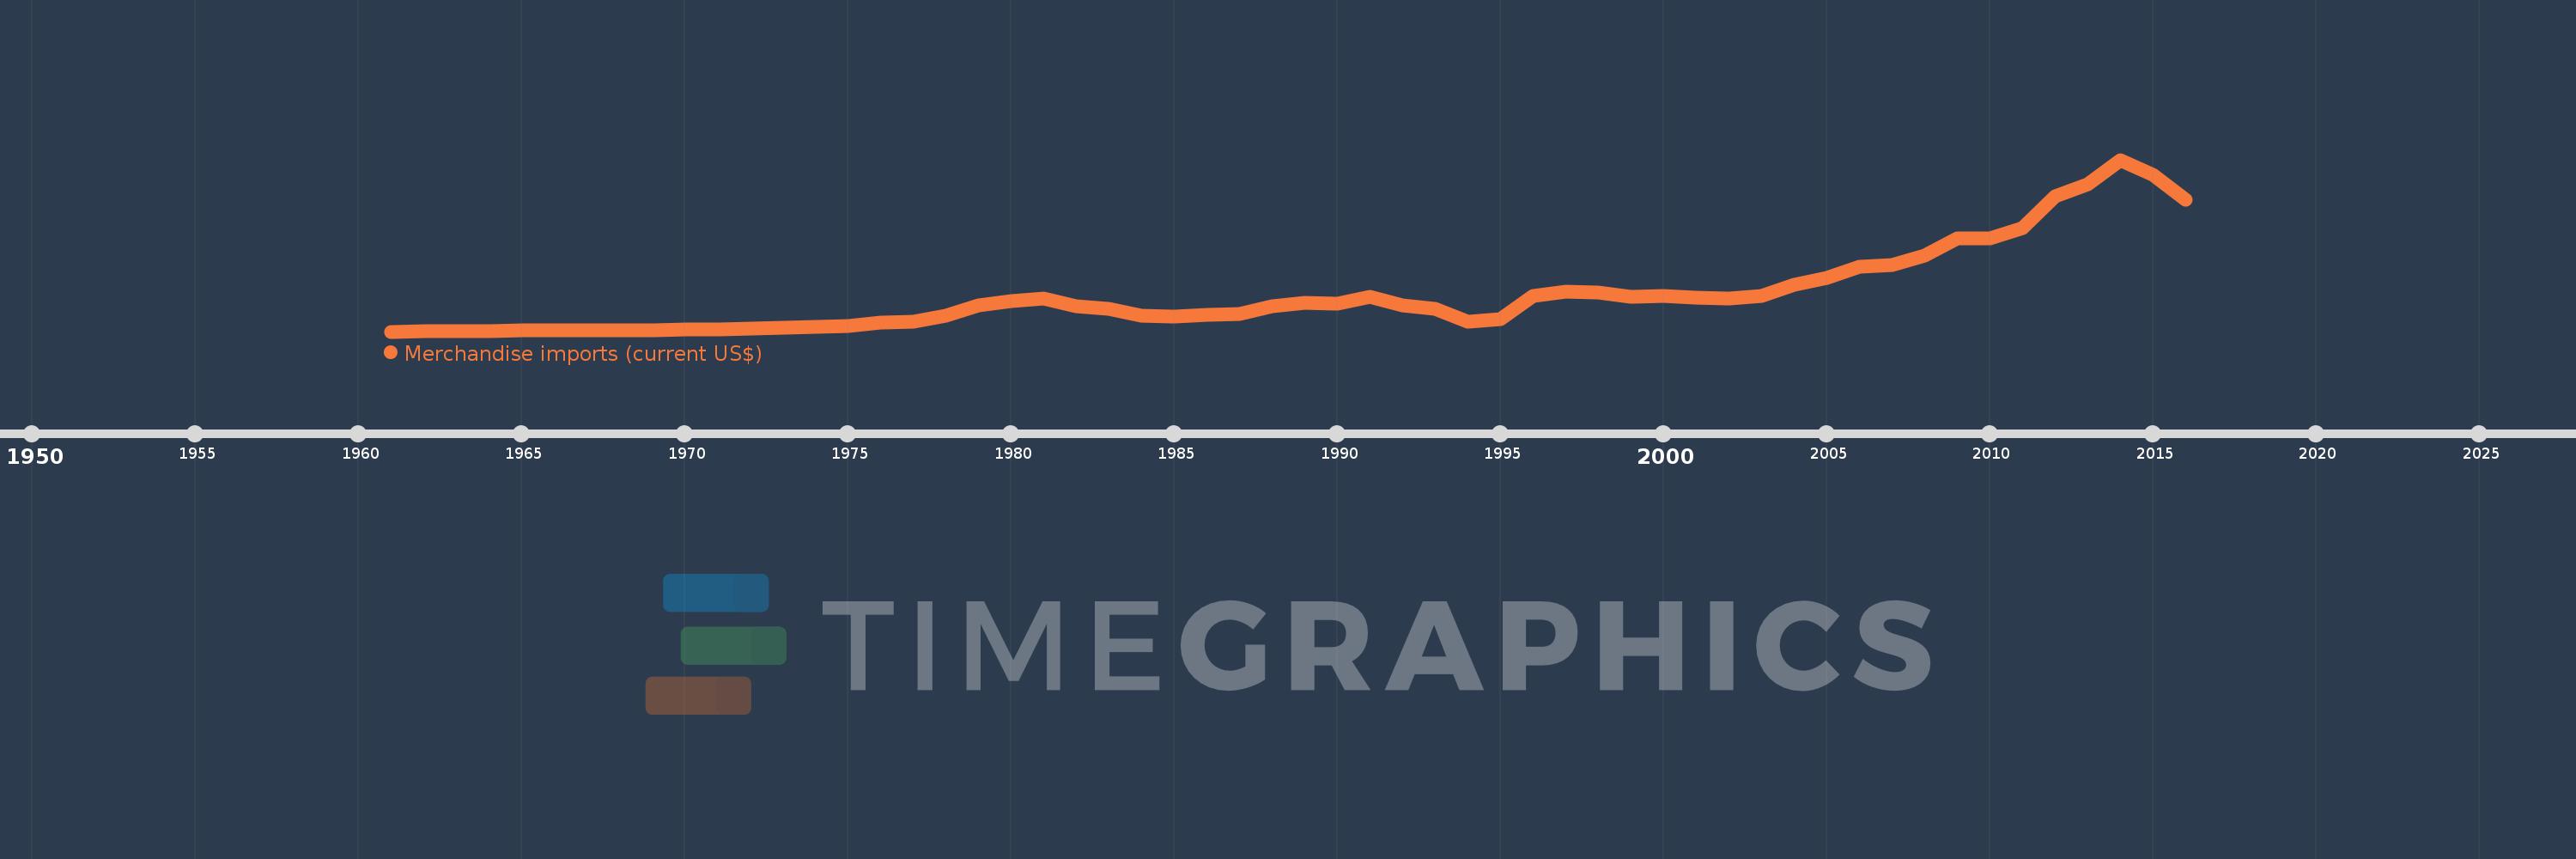
Merchandise imports (current US$)
2016,2015,2014,2013,2012,2011,2010,2009,2008,2007,2006,2005,2004,2003,2002,2001,2000,1999,1998,1997,1996,1995,1994,1993,1992,1991,1990,1989,1988,1987,1986,1985,1984,1983,1982,1981,1980,1979,1978,1977,1976,1975,1974,1973,1972,1971,1970,1969,1968,1967,1966,1965,1964,1963,1962,1961
This statistics in other country:
AfghanistanAlbaniaAlgeriaAmerican SamoaAngolaAntigua and BarbudaArab WorldArgentinaArmeniaArubaAustraliaAustriaAzerbaijanBahamas, TheBahrainBangladeshBarbadosBelarusBelgiumBelizeBeninBermudaBhutanBoliviaBosnia and HerzegovinaBotswanaBrazilBrunei DarussalamBulgariaBurkina FasoBurundiCabo VerdeCambodiaCameroonCanadaCaribbean small statesCentral African RepublicCentral Europe and the BalticsChadChileChinaColombiaComorosCongo, Dem. Rep.Congo, Rep.Costa RicaCote d'IvoireCroatiaCubaCuracaoCyprusCzech RepublicDenmarkDjiboutiDominicaDominican RepublicEarly-demographic dividendEast Asia & PacificEast Asia & Pacific (excluding high income)East Asia & Pacific (IDA & IBRD countries)EcuadorEgypt, Arab Rep.El SalvadorEquatorial GuineaEritreaEstoniaEthiopiaEuro areaEurope & Central AsiaEurope & Central Asia (excluding high income)Europe & Central Asia (IDA & IBRD countries)European UnionFaroe IslandsFijiFinlandFragile and conflict affected situationsFranceFrench PolynesiaGabonGambia, TheGeorgiaGermanyGhanaGreeceGreenlandGrenadaGuatemalaGuineaGuinea-BissauGuyanaHaitiHeavily indebted poor countries (HIPC)High incomeHondurasHong Kong SAR, ChinaHungaryIBRD onlyIcelandIDA & IBRD totalIDA blendIDA onlyIDA totalIndiaIndonesiaIran, Islamic Rep.IraqIrelandIsraelItalyJamaicaJapanJordanKazakhstanKenyaKiribatiKorea, Dem. People’s Rep.Korea, Rep.KuwaitKyrgyz RepublicLao PDRLate-demographic dividendLatin America & Caribbean Latin America & Caribbean (excluding high income)Latin America & the Caribbean (IDA & IBRD countries)LatviaLeast developed countries: UN classificationLebanonLesothoLiberiaLibyaLithuaniaLow & middle incomeLow incomeLower middle incomeLuxembourgMacao SAR, ChinaMacedonia, FYRMadagascarMalawiMalaysiaMaldivesMaliMaltaMarshall IslandsMauritaniaMauritiusMexicoMicronesia, Fed. Sts.Middle East & North AfricaMiddle East & North Africa (excluding high income)Middle East & North Africa (IDA & IBRD countries)Middle incomeMoldovaMongoliaMontenegroMoroccoMozambiqueMyanmarNamibiaNepalNetherlandsNew CaledoniaNew ZealandNicaraguaNigerNigeriaNorth AmericaNorthern Mariana IslandsNorwayOECD membersOmanOther small statesPacific island small statesPakistanPalauPanamaPapua New GuineaParaguayPeruPhilippinesPolandPortugalPost-demographic dividendPre-demographic dividendQatarRomaniaRussian FederationRwandaSamoaSao Tome and PrincipeSaudi ArabiaSenegalSerbiaSeychellesSierra LeoneSingaporeSint Maarten (Dutch part)Slovak RepublicSloveniaSmall statesSolomon IslandsSouth AfricaSouth AsiaSouth Asia (IDA & IBRD)SpainSri LankaSt. Kitts and NevisSt. LuciaSt. Martin (French part)St. Vincent and the GrenadinesSub-Saharan Africa Sub-Saharan Africa (excluding high income)Sub-Saharan Africa (IDA & IBRD countries)SudanSurinameSwazilandSwedenSwitzerlandSyrian Arab RepublicTajikistanTanzaniaThailandTimor-LesteTogoTongaTrinidad and TobagoTunisiaTurkeyTurkmenistanTuvaluUgandaUkraineUnited Arab EmiratesUnited KingdomUnited StatesUpper middle incomeUruguayUzbekistanVanuatuVenezuela, RBVietnamWorldYemen, Rep.ZambiaZimbabwe Timeline:
This timeline shows a graph from 1961 to 2016 of Togo. No data until 1960. Number of actual observations by date: 56.
Source name:
World Development Indicators
Source organization:
World Trade Organization.
Categories, topics:
Private Sector, Trade
Last updated:
apr 23, 2017
Indicators value changes by year
Minimum:
26.137 mln
jan 1, 1961
Maximum:
2.769 bln
jan 1, 2014
At the date of observation
Value
Absolute change
Change from previous value
jan 1, 1961
26.137 mln
+26.137 mln
0.0%
jan 1, 1962
26.234 mln
+97.2K
0.37%
jan 1, 1963
27.239 mln
+1.005 mln
3.83%
jan 1, 1964
29.034 mln
+1.795 mln
6.59%
jan 1, 1965
41.669 mln
+12.635 mln
43.52%
jan 1, 1966
44.966 mln
+3.297 mln
7.91%
jan 1, 1967
47.267 mln
+2.301 mln
5.12%
jan 1, 1968
45.1 mln
-2.167 mln
-4.59%
jan 1, 1969
47.085 mln
+1.985 mln
4.4%
jan 1, 1970
56.277 mln
+9.192 mln
19.52%
jan 1, 1971
64.557 mln
+8.28 mln
14.71%
jan 1, 1972
70.412 mln
+5.855 mln
9.07%
jan 1, 1973
84.852 mln
+14.441 mln
20.51%
jan 1, 1974
100.505 mln
+15.653 mln
18.45%
jan 1, 1975
119.401 mln
+18.896 mln
18.8%
jan 1, 1976
174.192 mln
+54.791 mln
45.89%
jan 1, 1977
185.427 mln
+11.235 mln
6.45%
jan 1, 1978
284.317 mln
+98.89 mln
53.33%
jan 1, 1979
449.689 mln
+165.372 mln
58.16%
jan 1, 1980
518.734 mln
+69.045 mln
15.35%
jan 1, 1981
551.0 mln
+32.266 mln
6.22%
jan 1, 1982
434.0 mln
-117.0 mln
-21.23%
jan 1, 1983
393.0 mln
-41.0 mln
-9.45%
jan 1, 1984
282.0 mln
-111.0 mln
-28.24%
jan 1, 1985
271.0 mln
-11.0 mln
-3.9%
jan 1, 1986
288.0 mln
+17.0 mln
6.27%
jan 1, 1987
312.0 mln
+24.0 mln
8.33%
jan 1, 1988
424.0 mln
+112.0 mln
35.9%
jan 1, 1989
487.0 mln
+63.0 mln
14.86%
jan 1, 1990
472.0 mln
-15.0 mln
-3.08%
jan 1, 1991
581.0 mln
+109.0 mln
23.09%
jan 1, 1992
443.0 mln
-138.0 mln
-23.75%
jan 1, 1993
394.0 mln
-49.0 mln
-11.06%
jan 1, 1994
179.0 mln
-215.0 mln
-54.57%
jan 1, 1995
222.0 mln
+43.0 mln
24.02%
jan 1, 1996
594.0 mln
+372.0 mln
167.57%
jan 1, 1997
664.0 mln
+70.0 mln
11.78%
jan 1, 1998
645.0 mln
-19.0 mln
-2.86%
jan 1, 1999
588.0 mln
-57.0 mln
-8.84%
jan 1, 2000
597.0 mln
+9.0 mln
1.53%
jan 1, 2001
562.0 mln
-35.0 mln
-5.86%
jan 1, 2002
553.0 mln
-9.0 mln
-1.6%
jan 1, 2003
591.0 mln
+38.0 mln
6.87%
jan 1, 2004
775.0 mln
+184.0 mln
31.13%
jan 1, 2005
880.0 mln
+105.0 mln
13.55%
jan 1, 2006
1.06 bln
+180.214 mln
20.48%
jan 1, 2007
1.085 bln
+24.439 mln
2.31%
jan 1, 2008
1.237 bln
+152.463 mln
14.06%
jan 1, 2009
1.509 bln
+272.271 mln
22.01%
jan 1, 2010
1.509 bln
-861.0K
-0.06%
jan 1, 2011
1.683 bln
+174.169 mln
11.55%
jan 1, 2012
2.187 bln
+504.579 mln
29.99%
jan 1, 2013
2.38 bln
+193.207 mln
8.83%
jan 1, 2014
2.769 bln
+388.93 mln
16.34%
jan 1, 2015
2.529 bln
-239.957 mln
-8.66%
jan 1, 2016
2.127 bln
-402.816 mln
-15.93%
Ranking of countries by current statistics by years


Comments: