29
/
en
AIzaSyAYiBZKx7MnpbEhh9jyipgxe19OcubqV5w
April 1, 2024
188077
Malaysia
MYS
true
2
1
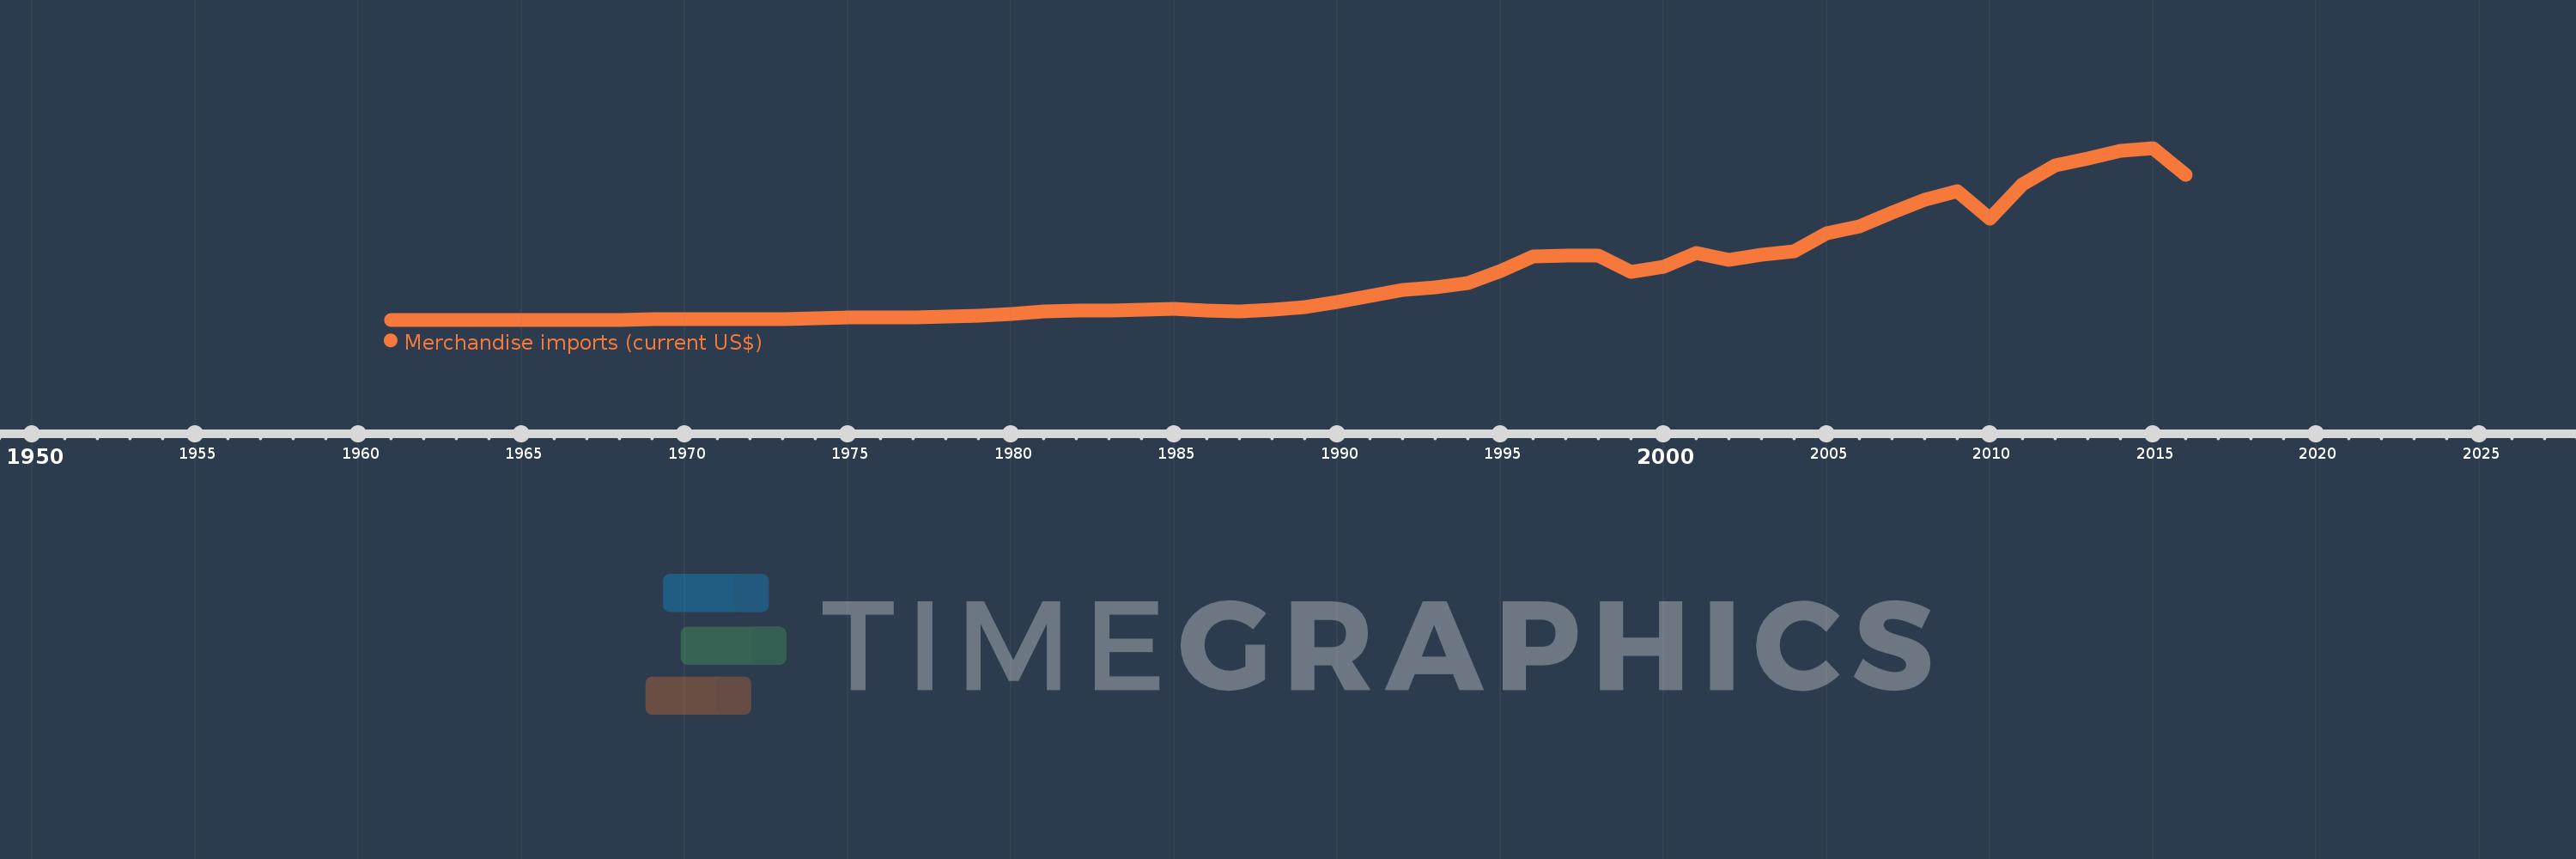
Merchandise imports (current US$)
2016,2015,2014,2013,2012,2011,2010,2009,2008,2007,2006,2005,2004,2003,2002,2001,2000,1999,1998,1997,1996,1995,1994,1993,1992,1991,1990,1989,1988,1987,1986,1985,1984,1983,1982,1981,1980,1979,1978,1977,1976,1975,1974,1973,1972,1971,1970,1969,1968,1967,1966,1965,1964,1963,1962,1961
This statistics in other country:
AfghanistanAlbaniaAlgeriaAmerican SamoaAngolaAntigua and BarbudaArab WorldArgentinaArmeniaArubaAustraliaAustriaAzerbaijanBahamas, TheBahrainBangladeshBarbadosBelarusBelgiumBelizeBeninBermudaBhutanBoliviaBosnia and HerzegovinaBotswanaBrazilBrunei DarussalamBulgariaBurkina FasoBurundiCabo VerdeCambodiaCameroonCanadaCaribbean small statesCentral African RepublicCentral Europe and the BalticsChadChileChinaColombiaComorosCongo, Dem. Rep.Congo, Rep.Costa RicaCote d'IvoireCroatiaCubaCuracaoCyprusCzech RepublicDenmarkDjiboutiDominicaDominican RepublicEarly-demographic dividendEast Asia & PacificEast Asia & Pacific (excluding high income)East Asia & Pacific (IDA & IBRD countries)EcuadorEgypt, Arab Rep.El SalvadorEquatorial GuineaEritreaEstoniaEthiopiaEuro areaEurope & Central AsiaEurope & Central Asia (excluding high income)Europe & Central Asia (IDA & IBRD countries)European UnionFaroe IslandsFijiFinlandFragile and conflict affected situationsFranceFrench PolynesiaGabonGambia, TheGeorgiaGermanyGhanaGreeceGreenlandGrenadaGuatemalaGuineaGuinea-BissauGuyanaHaitiHeavily indebted poor countries (HIPC)High incomeHondurasHong Kong SAR, ChinaHungaryIBRD onlyIcelandIDA & IBRD totalIDA blendIDA onlyIDA totalIndiaIndonesiaIran, Islamic Rep.IraqIrelandIsraelItalyJamaicaJapanJordanKazakhstanKenyaKiribatiKorea, Dem. People’s Rep.Korea, Rep.KuwaitKyrgyz RepublicLao PDRLate-demographic dividendLatin America & Caribbean Latin America & Caribbean (excluding high income)Latin America & the Caribbean (IDA & IBRD countries)LatviaLeast developed countries: UN classificationLebanonLesothoLiberiaLibyaLithuaniaLow & middle incomeLow incomeLower middle incomeLuxembourgMacao SAR, ChinaMacedonia, FYRMadagascarMalawiMalaysiaMaldivesMaliMaltaMarshall IslandsMauritaniaMauritiusMexicoMicronesia, Fed. Sts.Middle East & North AfricaMiddle East & North Africa (excluding high income)Middle East & North Africa (IDA & IBRD countries)Middle incomeMoldovaMongoliaMontenegroMoroccoMozambiqueMyanmarNamibiaNepalNetherlandsNew CaledoniaNew ZealandNicaraguaNigerNigeriaNorth AmericaNorthern Mariana IslandsNorwayOECD membersOmanOther small statesPacific island small statesPakistanPalauPanamaPapua New GuineaParaguayPeruPhilippinesPolandPortugalPost-demographic dividendPre-demographic dividendQatarRomaniaRussian FederationRwandaSamoaSao Tome and PrincipeSaudi ArabiaSenegalSerbiaSeychellesSierra LeoneSingaporeSint Maarten (Dutch part)Slovak RepublicSloveniaSmall statesSolomon IslandsSouth AfricaSouth AsiaSouth Asia (IDA & IBRD)SpainSri LankaSt. Kitts and NevisSt. LuciaSt. Martin (French part)St. Vincent and the GrenadinesSub-Saharan Africa Sub-Saharan Africa (excluding high income)Sub-Saharan Africa (IDA & IBRD countries)SudanSurinameSwazilandSwedenSwitzerlandSyrian Arab RepublicTajikistanTanzaniaThailandTimor-LesteTogoTongaTrinidad and TobagoTunisiaTurkeyTurkmenistanTuvaluUgandaUkraineUnited Arab EmiratesUnited KingdomUnited StatesUpper middle incomeUruguayUzbekistanVanuatuVenezuela, RBVietnamWorldYemen, Rep.ZambiaZimbabwe Timeline:
This timeline shows a graph from 1961 to 2016 of Malaysia. No data until 1960. Number of actual observations by date: 56.
Source name:
World Development Indicators
Source organization:
World Trade Organization.
Categories, topics:
Private Sector, Trade
Last updated:
apr 23, 2017
Indicators value changes by year
Minimum:
910.095 mln
jan 1, 1961
Maximum:
208.851 bln
jan 1, 2015
At the date of observation
Value
Absolute change
Change from previous value
jan 1, 1961
910.095 mln
+910.095 mln
0.0%
jan 1, 1962
919.895 mln
+9.8 mln
1.08%
jan 1, 1963
998.295 mln
+78.4 mln
8.52%
jan 1, 1964
1.043 bln
+44.755 mln
4.48%
jan 1, 1965
1.047 bln
+3.92 mln
0.38%
jan 1, 1966
1.096 bln
+49.32 mln
4.71%
jan 1, 1967
1.104 bln
+7.84 mln
0.72%
jan 1, 1968
1.086 bln
-17.96 mln
-1.63%
jan 1, 1969
1.16 bln
+74.15 mln
6.83%
jan 1, 1970
1.178 bln
+17.32 mln
1.49%
jan 1, 1971
1.401 bln
+223.11 mln
18.95%
jan 1, 1972
1.447 bln
+46.42 mln
3.31%
jan 1, 1973
1.611 bln
+164.08 mln
11.34%
jan 1, 1974
2.45 bln
+838.99 mln
52.07%
jan 1, 1975
4.114 bln
+1.664 bln
67.91%
jan 1, 1976
3.566 bln
-548.27 mln
-13.33%
jan 1, 1977
3.824 bln
+258.31 mln
7.24%
jan 1, 1978
4.542 bln
+717.79 mln
18.77%
jan 1, 1979
5.909 bln
+1.367 bln
30.1%
jan 1, 1980
7.849 bln
+1.939 bln
32.82%
jan 1, 1981
10.82 bln
+2.971 bln
37.86%
jan 1, 1982
11.581 bln
+761.0 mln
7.03%
jan 1, 1983
12.395 bln
+814.0 mln
7.03%
jan 1, 1984
13.198 bln
+803.0 mln
6.48%
jan 1, 1985
14.069 bln
+871.0 mln
6.6%
jan 1, 1986
12.301 bln
-1.768 bln
-12.57%
jan 1, 1987
10.823 bln
-1.478 bln
-12.02%
jan 1, 1988
12.701 bln
+1.878 bln
17.35%
jan 1, 1989
16.551 bln
+3.85 bln
30.31%
jan 1, 1990
22.496 bln
+5.945 bln
35.92%
jan 1, 1991
29.258 bln
+6.762 bln
30.06%
jan 1, 1992
36.648 bln
+7.39 bln
25.26%
jan 1, 1993
39.855 bln
+3.207 bln
8.75%
jan 1, 1994
45.65 bln
+5.795 bln
14.54%
jan 1, 1995
59.6 bln
+13.95 bln
30.56%
jan 1, 1996
77.691 bln
+18.091 bln
30.35%
jan 1, 1997
78.418 bln
+727.0 mln
0.94%
jan 1, 1998
79.03 bln
+612.0 mln
0.78%
jan 1, 1999
58.319 bln
-20.711 bln
-26.21%
jan 1, 2000
64.966 bln
+6.647 bln
11.4%
jan 1, 2001
81.963 bln
+16.997 bln
26.16%
jan 1, 2002
73.866 bln
-8.097 bln
-9.88%
jan 1, 2003
79.869 bln
+6.003 bln
8.13%
jan 1, 2004
83.3 bln
+3.431 bln
4.3%
jan 1, 2005
105.283 bln
+21.983 bln
26.39%
jan 1, 2006
114.324 bln
+9.041 bln
8.59%
jan 1, 2007
130.441 bln
+16.117 bln
14.1%
jan 1, 2008
146.17 bln
+15.729 bln
12.06%
jan 1, 2009
156.348 bln
+10.178 bln
6.96%
jan 1, 2010
123.757 bln
-32.591 bln
-20.85%
jan 1, 2011
164.622 bln
+40.865 bln
33.02%
jan 1, 2012
187.473 bln
+22.851 bln
13.88%
jan 1, 2013
196.393 bln
+8.919 bln
4.76%
jan 1, 2014
205.897 bln
+9.504 bln
4.84%
jan 1, 2015
208.851 bln
+2.954 bln
1.43%
jan 1, 2016
175.961 bln
-32.889 bln
-15.75%
Ranking of countries by current statistics by years


Comments: