29
/
en
AIzaSyAYiBZKx7MnpbEhh9jyipgxe19OcubqV5w
April 1, 2024
76408
Bahamas, The
BHS
true
2
1
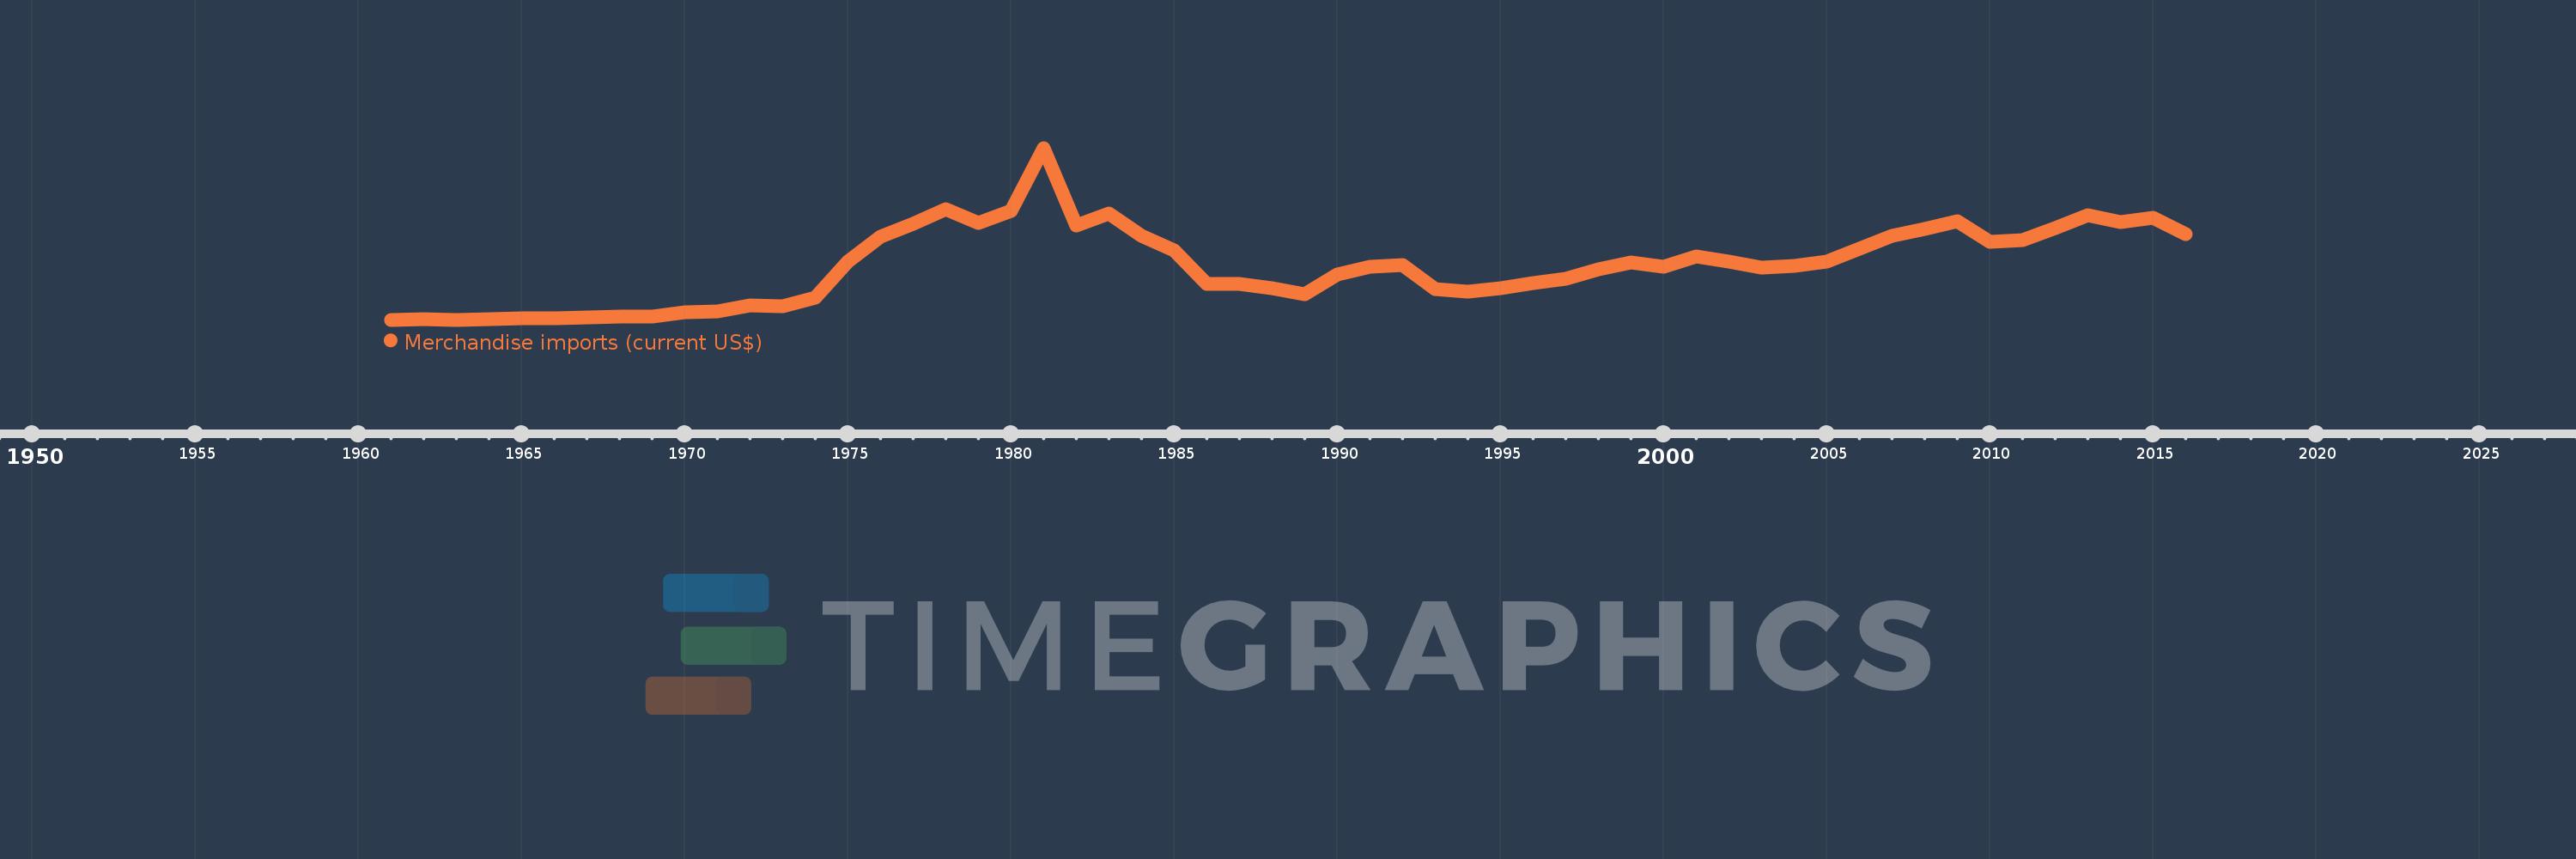
Merchandise imports (current US$)
2016,2015,2014,2013,2012,2011,2010,2009,2008,2007,2006,2005,2004,2003,2002,2001,2000,1999,1998,1997,1996,1995,1994,1993,1992,1991,1990,1989,1988,1987,1986,1985,1984,1983,1982,1981,1980,1979,1978,1977,1976,1975,1974,1973,1972,1971,1970,1969,1968,1967,1966,1965,1964,1963,1962,1961
This statistics in other country:
AfghanistanAlbaniaAlgeriaAmerican SamoaAngolaAntigua and BarbudaArab WorldArgentinaArmeniaArubaAustraliaAustriaAzerbaijanBahamas, TheBahrainBangladeshBarbadosBelarusBelgiumBelizeBeninBermudaBhutanBoliviaBosnia and HerzegovinaBotswanaBrazilBrunei DarussalamBulgariaBurkina FasoBurundiCabo VerdeCambodiaCameroonCanadaCaribbean small statesCentral African RepublicCentral Europe and the BalticsChadChileChinaColombiaComorosCongo, Dem. Rep.Congo, Rep.Costa RicaCote d'IvoireCroatiaCubaCuracaoCyprusCzech RepublicDenmarkDjiboutiDominicaDominican RepublicEarly-demographic dividendEast Asia & PacificEast Asia & Pacific (excluding high income)East Asia & Pacific (IDA & IBRD countries)EcuadorEgypt, Arab Rep.El SalvadorEquatorial GuineaEritreaEstoniaEthiopiaEuro areaEurope & Central AsiaEurope & Central Asia (excluding high income)Europe & Central Asia (IDA & IBRD countries)European UnionFaroe IslandsFijiFinlandFragile and conflict affected situationsFranceFrench PolynesiaGabonGambia, TheGeorgiaGermanyGhanaGreeceGreenlandGrenadaGuatemalaGuineaGuinea-BissauGuyanaHaitiHeavily indebted poor countries (HIPC)High incomeHondurasHong Kong SAR, ChinaHungaryIBRD onlyIcelandIDA & IBRD totalIDA blendIDA onlyIDA totalIndiaIndonesiaIran, Islamic Rep.IraqIrelandIsraelItalyJamaicaJapanJordanKazakhstanKenyaKiribatiKorea, Dem. People’s Rep.Korea, Rep.KuwaitKyrgyz RepublicLao PDRLate-demographic dividendLatin America & Caribbean Latin America & Caribbean (excluding high income)Latin America & the Caribbean (IDA & IBRD countries)LatviaLeast developed countries: UN classificationLebanonLesothoLiberiaLibyaLithuaniaLow & middle incomeLow incomeLower middle incomeLuxembourgMacao SAR, ChinaMacedonia, FYRMadagascarMalawiMalaysiaMaldivesMaliMaltaMarshall IslandsMauritaniaMauritiusMexicoMicronesia, Fed. Sts.Middle East & North AfricaMiddle East & North Africa (excluding high income)Middle East & North Africa (IDA & IBRD countries)Middle incomeMoldovaMongoliaMontenegroMoroccoMozambiqueMyanmarNamibiaNepalNetherlandsNew CaledoniaNew ZealandNicaraguaNigerNigeriaNorth AmericaNorthern Mariana IslandsNorwayOECD membersOmanOther small statesPacific island small statesPakistanPalauPanamaPapua New GuineaParaguayPeruPhilippinesPolandPortugalPost-demographic dividendPre-demographic dividendQatarRomaniaRussian FederationRwandaSamoaSao Tome and PrincipeSaudi ArabiaSenegalSerbiaSeychellesSierra LeoneSingaporeSint Maarten (Dutch part)Slovak RepublicSloveniaSmall statesSolomon IslandsSouth AfricaSouth AsiaSouth Asia (IDA & IBRD)SpainSri LankaSt. Kitts and NevisSt. LuciaSt. Martin (French part)St. Vincent and the GrenadinesSub-Saharan Africa Sub-Saharan Africa (excluding high income)Sub-Saharan Africa (IDA & IBRD countries)SudanSurinameSwazilandSwedenSwitzerlandSyrian Arab RepublicTajikistanTanzaniaThailandTimor-LesteTogoTongaTrinidad and TobagoTunisiaTurkeyTurkmenistanTuvaluUgandaUkraineUnited Arab EmiratesUnited KingdomUnited StatesUpper middle incomeUruguayUzbekistanVanuatuVenezuela, RBVietnamWorldYemen, Rep.ZambiaZimbabwe Timeline:
This timeline shows a graph from 1961 to 2016 of Bahamas, The. No data until 1960. Number of actual observations by date: 56.
Source name:
World Development Indicators
Source organization:
World Trade Organization.
Categories, topics:
Private Sector, Trade
Last updated:
apr 23, 2017
Indicators value changes by year
Minimum:
66.0 mln
jan 1, 1961
Maximum:
5.519 bln
jan 1, 1981
At the date of observation
Value
Absolute change
Change from previous value
jan 1, 1961
66.0 mln
+66.0 mln
0.0%
jan 1, 1962
85.0 mln
+19.0 mln
28.79%
jan 1, 1963
69.0 mln
-16.0 mln
-18.82%
jan 1, 1964
79.0 mln
+10.0 mln
14.49%
jan 1, 1965
100.0 mln
+21.0 mln
26.58%
jan 1, 1966
104.86 mln
+4.86 mln
4.86%
jan 1, 1967
139.16 mln
+34.3 mln
32.71%
jan 1, 1968
162.68 mln
+23.52 mln
16.9%
jan 1, 1969
176.4 mln
+13.72 mln
8.43%
jan 1, 1970
295.959 mln
+119.559 mln
67.78%
jan 1, 1971
337.426 mln
+41.467 mln
14.01%
jan 1, 1972
511.0 mln
+173.574 mln
51.44%
jan 1, 1973
485.0 mln
-26.0 mln
-5.09%
jan 1, 1974
764.0 mln
+279.0 mln
57.53%
jan 1, 1975
1.908 bln
+1.144 bln
149.74%
jan 1, 1976
2.697 bln
+789.0 mln
41.35%
jan 1, 1977
3.125 bln
+428.0 mln
15.87%
jan 1, 1978
3.568 bln
+443.0 mln
14.18%
jan 1, 1979
3.15 bln
-418.0 mln
-11.72%
jan 1, 1980
3.514 bln
+364.0 mln
11.56%
jan 1, 1981
5.519 bln
+2.005 bln
57.06%
jan 1, 1982
3.068 bln
-2.451 bln
-44.41%
jan 1, 1983
3.428 bln
+360.0 mln
11.73%
jan 1, 1984
2.723 bln
-705.0 mln
-20.57%
jan 1, 1985
2.26 bln
-463.0 mln
-17.0%
jan 1, 1986
1.212 bln
-1.048 bln
-46.37%
jan 1, 1987
1.193 bln
-19.0 mln
-1.57%
jan 1, 1988
1.064 bln
-129.0 mln
-10.81%
jan 1, 1989
888.0 mln
-176.0 mln
-16.54%
jan 1, 1990
1.516 bln
+628.0 mln
70.72%
jan 1, 1991
1.738 bln
+222.0 mln
14.64%
jan 1, 1992
1.806 bln
+68.0 mln
3.91%
jan 1, 1993
1.038 bln
-768.0 mln
-42.52%
jan 1, 1994
954.0 mln
-84.0 mln
-8.09%
jan 1, 1995
1.056 bln
+102.0 mln
10.69%
jan 1, 1996
1.243 bln
+187.0 mln
17.71%
jan 1, 1997
1.366 bln
+123.0 mln
9.9%
jan 1, 1998
1.666 bln
+300.0 mln
21.96%
jan 1, 1999
1.873 bln
+207.0 mln
12.42%
jan 1, 2000
1.757 bln
-116.0 mln
-6.19%
jan 1, 2001
2.074 bln
+317.0 mln
18.04%
jan 1, 2002
1.912 bln
-162.0 mln
-7.81%
jan 1, 2003
1.728 bln
-184.0 mln
-9.62%
jan 1, 2004
1.762 bln
+34.0 mln
1.97%
jan 1, 2005
1.905 bln
+143.0 mln
8.12%
jan 1, 2006
2.312 bln
+406.6 mln
21.34%
jan 1, 2007
2.727 bln
+415.7 mln
17.98%
jan 1, 2008
2.956 bln
+229.0 mln
8.4%
jan 1, 2009
3.199 bln
+242.7 mln
8.21%
jan 1, 2010
2.535 bln
-663.7 mln
-20.75%
jan 1, 2011
2.591 bln
+55.3 mln
2.18%
jan 1, 2012
2.966 bln
+375.1 mln
14.48%
jan 1, 2013
3.385 bln
+419.8 mln
14.16%
jan 1, 2014
3.166 bln
-219.6 mln
-6.49%
jan 1, 2015
3.309 bln
+143.2 mln
4.52%
jan 1, 2016
2.78 bln
-529.1 mln
-15.99%
Ranking of countries by current statistics by years


Comments: