29
/
en
AIzaSyAYiBZKx7MnpbEhh9jyipgxe19OcubqV5w
April 1, 2024
115070
Croatia
HRV
true
2
1
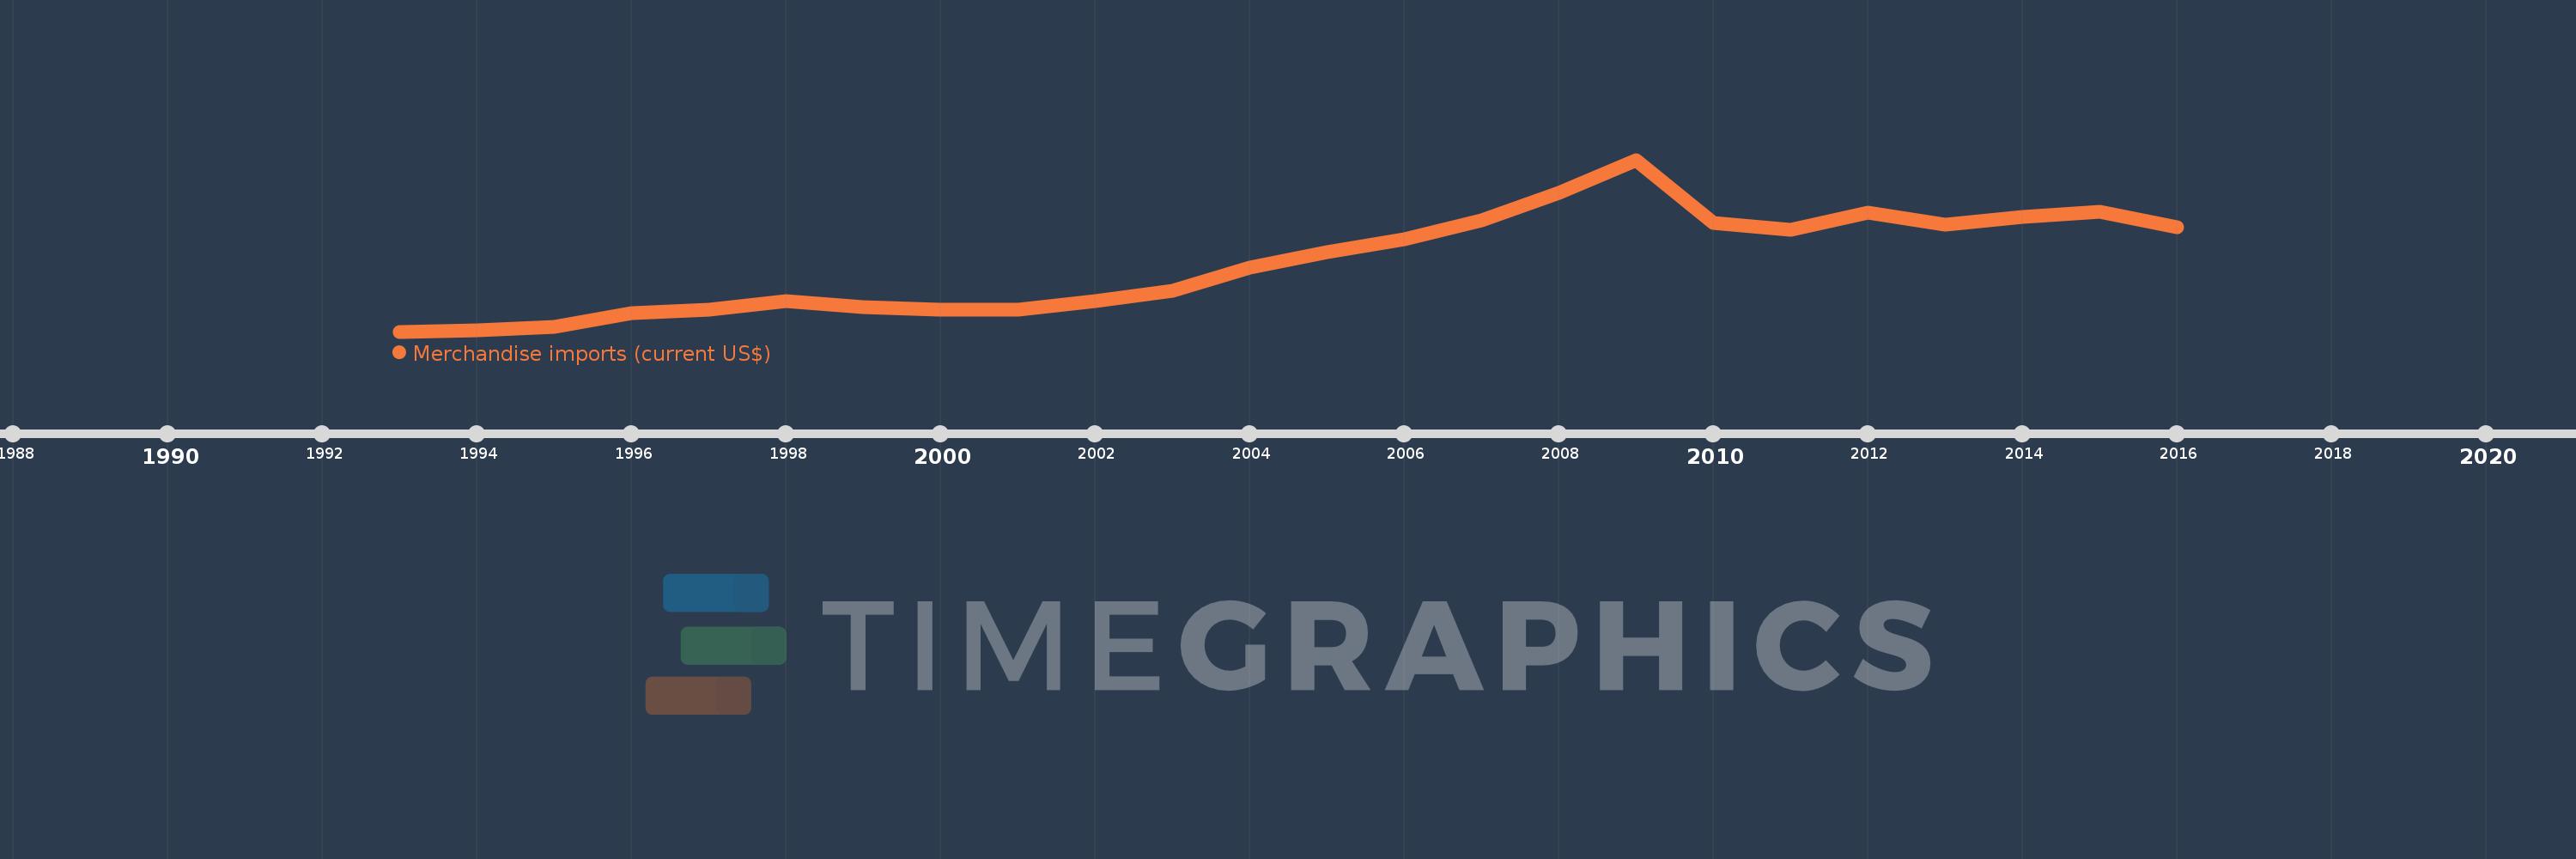
Merchandise imports (current US$)
2016,2015,2014,2013,2012,2011,2010,2009,2008,2007,2006,2005,2004,2003,2002,2001,2000,1999,1998,1997,1996,1995,1994,1993
This statistics in other country:
AfghanistanAlbaniaAlgeriaAmerican SamoaAngolaAntigua and BarbudaArab WorldArgentinaArmeniaArubaAustraliaAustriaAzerbaijanBahamas, TheBahrainBangladeshBarbadosBelarusBelgiumBelizeBeninBermudaBhutanBoliviaBosnia and HerzegovinaBotswanaBrazilBrunei DarussalamBulgariaBurkina FasoBurundiCabo VerdeCambodiaCameroonCanadaCaribbean small statesCentral African RepublicCentral Europe and the BalticsChadChileChinaColombiaComorosCongo, Dem. Rep.Congo, Rep.Costa RicaCote d'IvoireCroatiaCubaCuracaoCyprusCzech RepublicDenmarkDjiboutiDominicaDominican RepublicEarly-demographic dividendEast Asia & PacificEast Asia & Pacific (excluding high income)East Asia & Pacific (IDA & IBRD countries)EcuadorEgypt, Arab Rep.El SalvadorEquatorial GuineaEritreaEstoniaEthiopiaEuro areaEurope & Central AsiaEurope & Central Asia (excluding high income)Europe & Central Asia (IDA & IBRD countries)European UnionFaroe IslandsFijiFinlandFragile and conflict affected situationsFranceFrench PolynesiaGabonGambia, TheGeorgiaGermanyGhanaGreeceGreenlandGrenadaGuatemalaGuineaGuinea-BissauGuyanaHaitiHeavily indebted poor countries (HIPC)High incomeHondurasHong Kong SAR, ChinaHungaryIBRD onlyIcelandIDA & IBRD totalIDA blendIDA onlyIDA totalIndiaIndonesiaIran, Islamic Rep.IraqIrelandIsraelItalyJamaicaJapanJordanKazakhstanKenyaKiribatiKorea, Dem. People’s Rep.Korea, Rep.KuwaitKyrgyz RepublicLao PDRLate-demographic dividendLatin America & Caribbean Latin America & Caribbean (excluding high income)Latin America & the Caribbean (IDA & IBRD countries)LatviaLeast developed countries: UN classificationLebanonLesothoLiberiaLibyaLithuaniaLow & middle incomeLow incomeLower middle incomeLuxembourgMacao SAR, ChinaMacedonia, FYRMadagascarMalawiMalaysiaMaldivesMaliMaltaMarshall IslandsMauritaniaMauritiusMexicoMicronesia, Fed. Sts.Middle East & North AfricaMiddle East & North Africa (excluding high income)Middle East & North Africa (IDA & IBRD countries)Middle incomeMoldovaMongoliaMontenegroMoroccoMozambiqueMyanmarNamibiaNepalNetherlandsNew CaledoniaNew ZealandNicaraguaNigerNigeriaNorth AmericaNorthern Mariana IslandsNorwayOECD membersOmanOther small statesPacific island small statesPakistanPalauPanamaPapua New GuineaParaguayPeruPhilippinesPolandPortugalPost-demographic dividendPre-demographic dividendQatarRomaniaRussian FederationRwandaSamoaSao Tome and PrincipeSaudi ArabiaSenegalSerbiaSeychellesSierra LeoneSingaporeSint Maarten (Dutch part)Slovak RepublicSloveniaSmall statesSolomon IslandsSouth AfricaSouth AsiaSouth Asia (IDA & IBRD)SpainSri LankaSt. Kitts and NevisSt. LuciaSt. Martin (French part)St. Vincent and the GrenadinesSub-Saharan Africa Sub-Saharan Africa (excluding high income)Sub-Saharan Africa (IDA & IBRD countries)SudanSurinameSwazilandSwedenSwitzerlandSyrian Arab RepublicTajikistanTanzaniaThailandTimor-LesteTogoTongaTrinidad and TobagoTunisiaTurkeyTurkmenistanTuvaluUgandaUkraineUnited Arab EmiratesUnited KingdomUnited StatesUpper middle incomeUruguayUzbekistanVanuatuVenezuela, RBVietnamWorldYemen, Rep.ZambiaZimbabwe Timeline:
This timeline shows a graph from 1993 to 2016 of Croatia. No data until 1992. Number of actual observations by date: 24.
Source name:
World Development Indicators
Source organization:
World Trade Organization.
Categories, topics:
Private Sector, Trade
Last updated:
apr 23, 2017
Indicators value changes by year
Minimum:
4.5 bln
jan 1, 1993
Maximum:
30.728 bln
jan 1, 2009
At the date of observation
Value
Absolute change
Change from previous value
jan 1, 1993
4.5 bln
+4.5 bln
0.0%
jan 1, 1994
4.666 bln
+166.0 mln
3.69%
jan 1, 1995
5.229 bln
+563.0 mln
12.07%
jan 1, 1996
7.352 bln
+2.123 bln
40.6%
jan 1, 1997
7.784 bln
+431.83 mln
5.87%
jan 1, 1998
9.101 bln
+1.318 bln
16.93%
jan 1, 1999
8.276 bln
-825.91 mln
-9.07%
jan 1, 2000
7.799 bln
-476.58 mln
-5.76%
jan 1, 2001
7.887 bln
+88.0 mln
1.13%
jan 1, 2002
9.147 bln
+1.26 bln
15.98%
jan 1, 2003
10.722 bln
+1.575 bln
17.22%
jan 1, 2004
14.209 bln
+3.487 bln
32.52%
jan 1, 2005
16.589 bln
+2.38 bln
16.75%
jan 1, 2006
18.599 bln
+2.01 bln
12.11%
jan 1, 2007
21.477 bln
+2.878 bln
15.47%
jan 1, 2008
25.617 bln
+4.141 bln
19.28%
jan 1, 2009
30.728 bln
+5.111 bln
19.95%
jan 1, 2010
21.123 bln
-9.606 bln
-31.26%
jan 1, 2011
20.067 bln
-1.056 bln
-5.0%
jan 1, 2012
22.663 bln
+2.596 bln
12.94%
jan 1, 2013
20.832 bln
-1.831 bln
-8.08%
jan 1, 2014
22.022 bln
+1.189 bln
5.71%
jan 1, 2015
22.79 bln
+767.863 mln
3.49%
jan 1, 2016
20.46 bln
-2.329 bln
-10.22%
Ranking of countries by current statistics by years


Comments: