29
/
en
AIzaSyAYiBZKx7MnpbEhh9jyipgxe19OcubqV5w
April 1, 2024
96387
Burundi
BDI
true
2
1
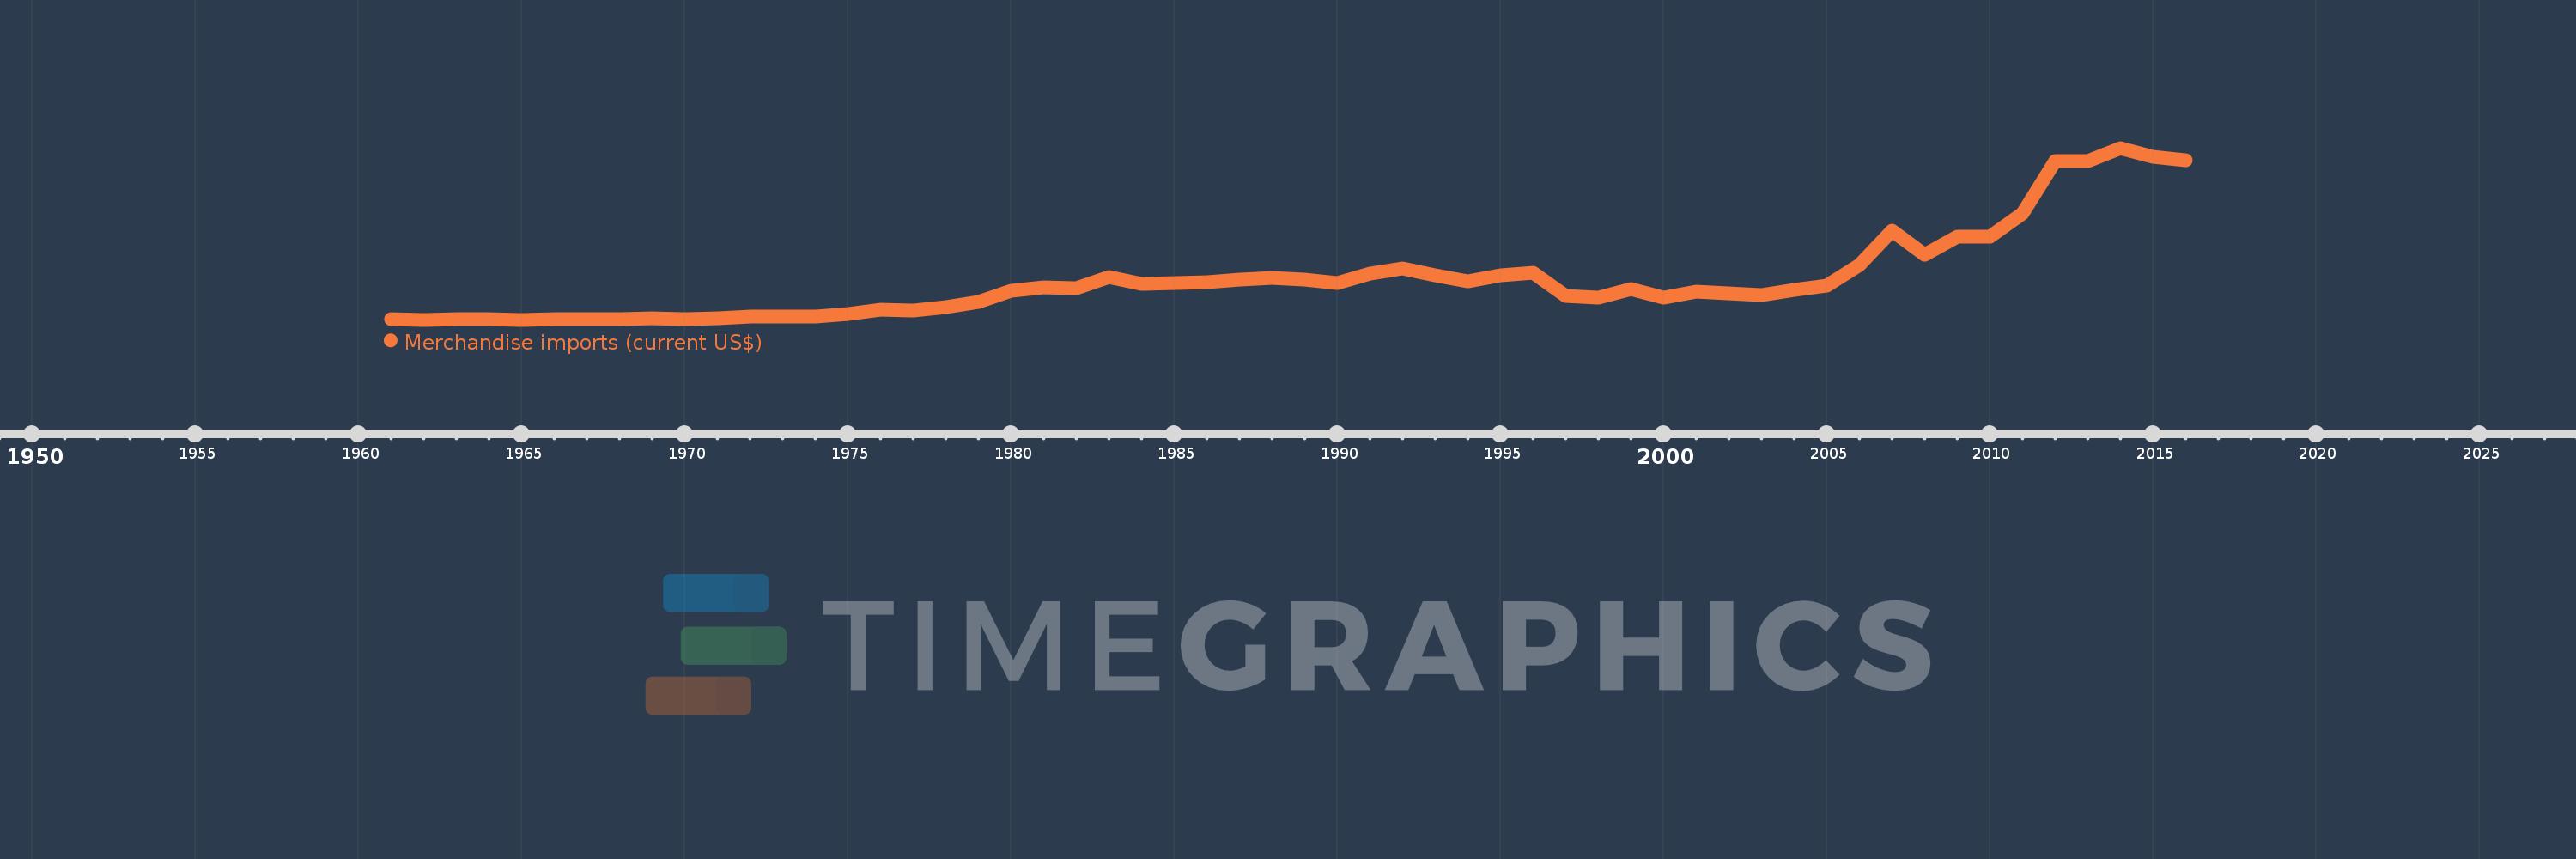
Merchandise imports (current US$)
2016,2015,2014,2013,2012,2011,2010,2009,2008,2007,2006,2005,2004,2003,2002,2001,2000,1999,1998,1997,1996,1995,1994,1993,1992,1991,1990,1989,1988,1987,1986,1985,1984,1983,1982,1981,1980,1979,1978,1977,1976,1975,1974,1973,1972,1971,1970,1969,1968,1967,1966,1965,1964,1963,1962,1961
This statistics in other country:
AfghanistanAlbaniaAlgeriaAmerican SamoaAngolaAntigua and BarbudaArab WorldArgentinaArmeniaArubaAustraliaAustriaAzerbaijanBahamas, TheBahrainBangladeshBarbadosBelarusBelgiumBelizeBeninBermudaBhutanBoliviaBosnia and HerzegovinaBotswanaBrazilBrunei DarussalamBulgariaBurkina FasoBurundiCabo VerdeCambodiaCameroonCanadaCaribbean small statesCentral African RepublicCentral Europe and the BalticsChadChileChinaColombiaComorosCongo, Dem. Rep.Congo, Rep.Costa RicaCote d'IvoireCroatiaCubaCuracaoCyprusCzech RepublicDenmarkDjiboutiDominicaDominican RepublicEarly-demographic dividendEast Asia & PacificEast Asia & Pacific (excluding high income)East Asia & Pacific (IDA & IBRD countries)EcuadorEgypt, Arab Rep.El SalvadorEquatorial GuineaEritreaEstoniaEthiopiaEuro areaEurope & Central AsiaEurope & Central Asia (excluding high income)Europe & Central Asia (IDA & IBRD countries)European UnionFaroe IslandsFijiFinlandFragile and conflict affected situationsFranceFrench PolynesiaGabonGambia, TheGeorgiaGermanyGhanaGreeceGreenlandGrenadaGuatemalaGuineaGuinea-BissauGuyanaHaitiHeavily indebted poor countries (HIPC)High incomeHondurasHong Kong SAR, ChinaHungaryIBRD onlyIcelandIDA & IBRD totalIDA blendIDA onlyIDA totalIndiaIndonesiaIran, Islamic Rep.IraqIrelandIsraelItalyJamaicaJapanJordanKazakhstanKenyaKiribatiKorea, Dem. People’s Rep.Korea, Rep.KuwaitKyrgyz RepublicLao PDRLate-demographic dividendLatin America & Caribbean Latin America & Caribbean (excluding high income)Latin America & the Caribbean (IDA & IBRD countries)LatviaLeast developed countries: UN classificationLebanonLesothoLiberiaLibyaLithuaniaLow & middle incomeLow incomeLower middle incomeLuxembourgMacao SAR, ChinaMacedonia, FYRMadagascarMalawiMalaysiaMaldivesMaliMaltaMarshall IslandsMauritaniaMauritiusMexicoMicronesia, Fed. Sts.Middle East & North AfricaMiddle East & North Africa (excluding high income)Middle East & North Africa (IDA & IBRD countries)Middle incomeMoldovaMongoliaMontenegroMoroccoMozambiqueMyanmarNamibiaNepalNetherlandsNew CaledoniaNew ZealandNicaraguaNigerNigeriaNorth AmericaNorthern Mariana IslandsNorwayOECD membersOmanOther small statesPacific island small statesPakistanPalauPanamaPapua New GuineaParaguayPeruPhilippinesPolandPortugalPost-demographic dividendPre-demographic dividendQatarRomaniaRussian FederationRwandaSamoaSao Tome and PrincipeSaudi ArabiaSenegalSerbiaSeychellesSierra LeoneSingaporeSint Maarten (Dutch part)Slovak RepublicSloveniaSmall statesSolomon IslandsSouth AfricaSouth AsiaSouth Asia (IDA & IBRD)SpainSri LankaSt. Kitts and NevisSt. LuciaSt. Martin (French part)St. Vincent and the GrenadinesSub-Saharan Africa Sub-Saharan Africa (excluding high income)Sub-Saharan Africa (IDA & IBRD countries)SudanSurinameSwazilandSwedenSwitzerlandSyrian Arab RepublicTajikistanTanzaniaThailandTimor-LesteTogoTongaTrinidad and TobagoTunisiaTurkeyTurkmenistanTuvaluUgandaUkraineUnited Arab EmiratesUnited KingdomUnited StatesUpper middle incomeUruguayUzbekistanVanuatuVenezuela, RBVietnamWorldYemen, Rep.ZambiaZimbabwe Timeline:
This timeline shows a graph from 1961 to 2016 of Burundi. No data until 1960. Number of actual observations by date: 56.
Source name:
World Development Indicators
Source organization:
World Trade Organization.
Categories, topics:
Private Sector, Trade
Last updated:
apr 23, 2017
Indicators value changes by year
Minimum:
17.0 mln
jan 1, 1962
Maximum:
811.206 mln
jan 1, 2014
At the date of observation
Value
Absolute change
Change from previous value
jan 1, 1961
21.0 mln
+21.0 mln
0.0%
jan 1, 1962
17.0 mln
-4.0 mln
-19.05%
jan 1, 1963
19.0 mln
+2.0 mln
11.76%
jan 1, 1964
18.32 mln
-680.0K
-3.58%
jan 1, 1965
17.0 mln
-1.32 mln
-7.21%
jan 1, 1966
18.0 mln
+1000.0K
5.88%
jan 1, 1967
20.0 mln
+2.0 mln
11.11%
jan 1, 1968
20.0 mln
0.0
0.0%
jan 1, 1969
22.811 mln
+2.811 mln
14.06%
jan 1, 1970
21.486 mln
-1.326 mln
-5.81%
jan 1, 1971
22.343 mln
+857.2K
3.99%
jan 1, 1972
29.863 mln
+7.52 mln
33.66%
jan 1, 1973
31.6 mln
+1.737 mln
5.82%
jan 1, 1974
31.297 mln
-303.2K
-0.96%
jan 1, 1975
43.098 mln
+11.802 mln
37.71%
jan 1, 1976
61.549 mln
+18.451 mln
42.81%
jan 1, 1977
57.881 mln
-3.668 mln
-5.96%
jan 1, 1978
74.189 mln
+16.308 mln
28.17%
jan 1, 1979
98.289 mln
+24.1 mln
32.48%
jan 1, 1980
152.456 mln
+54.167 mln
55.11%
jan 1, 1981
168.0 mln
+15.544 mln
10.2%
jan 1, 1982
161.0 mln
-7.0 mln
-4.17%
jan 1, 1983
213.0 mln
+52.0 mln
32.3%
jan 1, 1984
182.0 mln
-31.0 mln
-14.55%
jan 1, 1985
186.0 mln
+4.0 mln
2.2%
jan 1, 1986
189.0 mln
+3.0 mln
1.61%
jan 1, 1987
202.0 mln
+13.0 mln
6.88%
jan 1, 1988
212.0 mln
+10.0 mln
4.95%
jan 1, 1989
204.0 mln
-8.0 mln
-3.77%
jan 1, 1990
187.0 mln
-17.0 mln
-8.33%
jan 1, 1991
231.0 mln
+44.0 mln
23.53%
jan 1, 1992
255.0 mln
+24.0 mln
10.39%
jan 1, 1993
221.0 mln
-34.0 mln
-13.33%
jan 1, 1994
196.0 mln
-25.0 mln
-11.31%
jan 1, 1995
224.0 mln
+28.0 mln
14.29%
jan 1, 1996
234.0 mln
+10.0 mln
4.46%
jan 1, 1997
127.0 mln
-107.0 mln
-45.73%
jan 1, 1998
121.0 mln
-6.0 mln
-4.72%
jan 1, 1999
158.0 mln
+37.0 mln
30.58%
jan 1, 2000
118.0 mln
-40.0 mln
-25.32%
jan 1, 2001
148.0 mln
+30.0 mln
25.42%
jan 1, 2002
139.34 mln
-8.66 mln
-5.85%
jan 1, 2003
129.406 mln
-9.934 mln
-7.13%
jan 1, 2004
156.604 mln
+27.198 mln
21.02%
jan 1, 2005
176.224 mln
+19.62 mln
12.53%
jan 1, 2006
269.238 mln
+93.014 mln
52.78%
jan 1, 2007
430.743 mln
+161.505 mln
59.99%
jan 1, 2008
319.105 mln
-111.638 mln
-25.92%
jan 1, 2009
402.688 mln
+83.583 mln
26.19%
jan 1, 2010
402.225 mln
-462.945K
-0.11%
jan 1, 2011
508.797 mln
+106.572 mln
26.5%
jan 1, 2012
752.281 mln
+243.484 mln
47.85%
jan 1, 2013
751.087 mln
-1.194 mln
-0.16%
jan 1, 2014
811.206 mln
+60.119 mln
8.0%
jan 1, 2015
769.252 mln
-41.954 mln
-5.17%
jan 1, 2016
754.751 mln
-14.501 mln
-1.89%
Ranking of countries by current statistics by years


Comments: