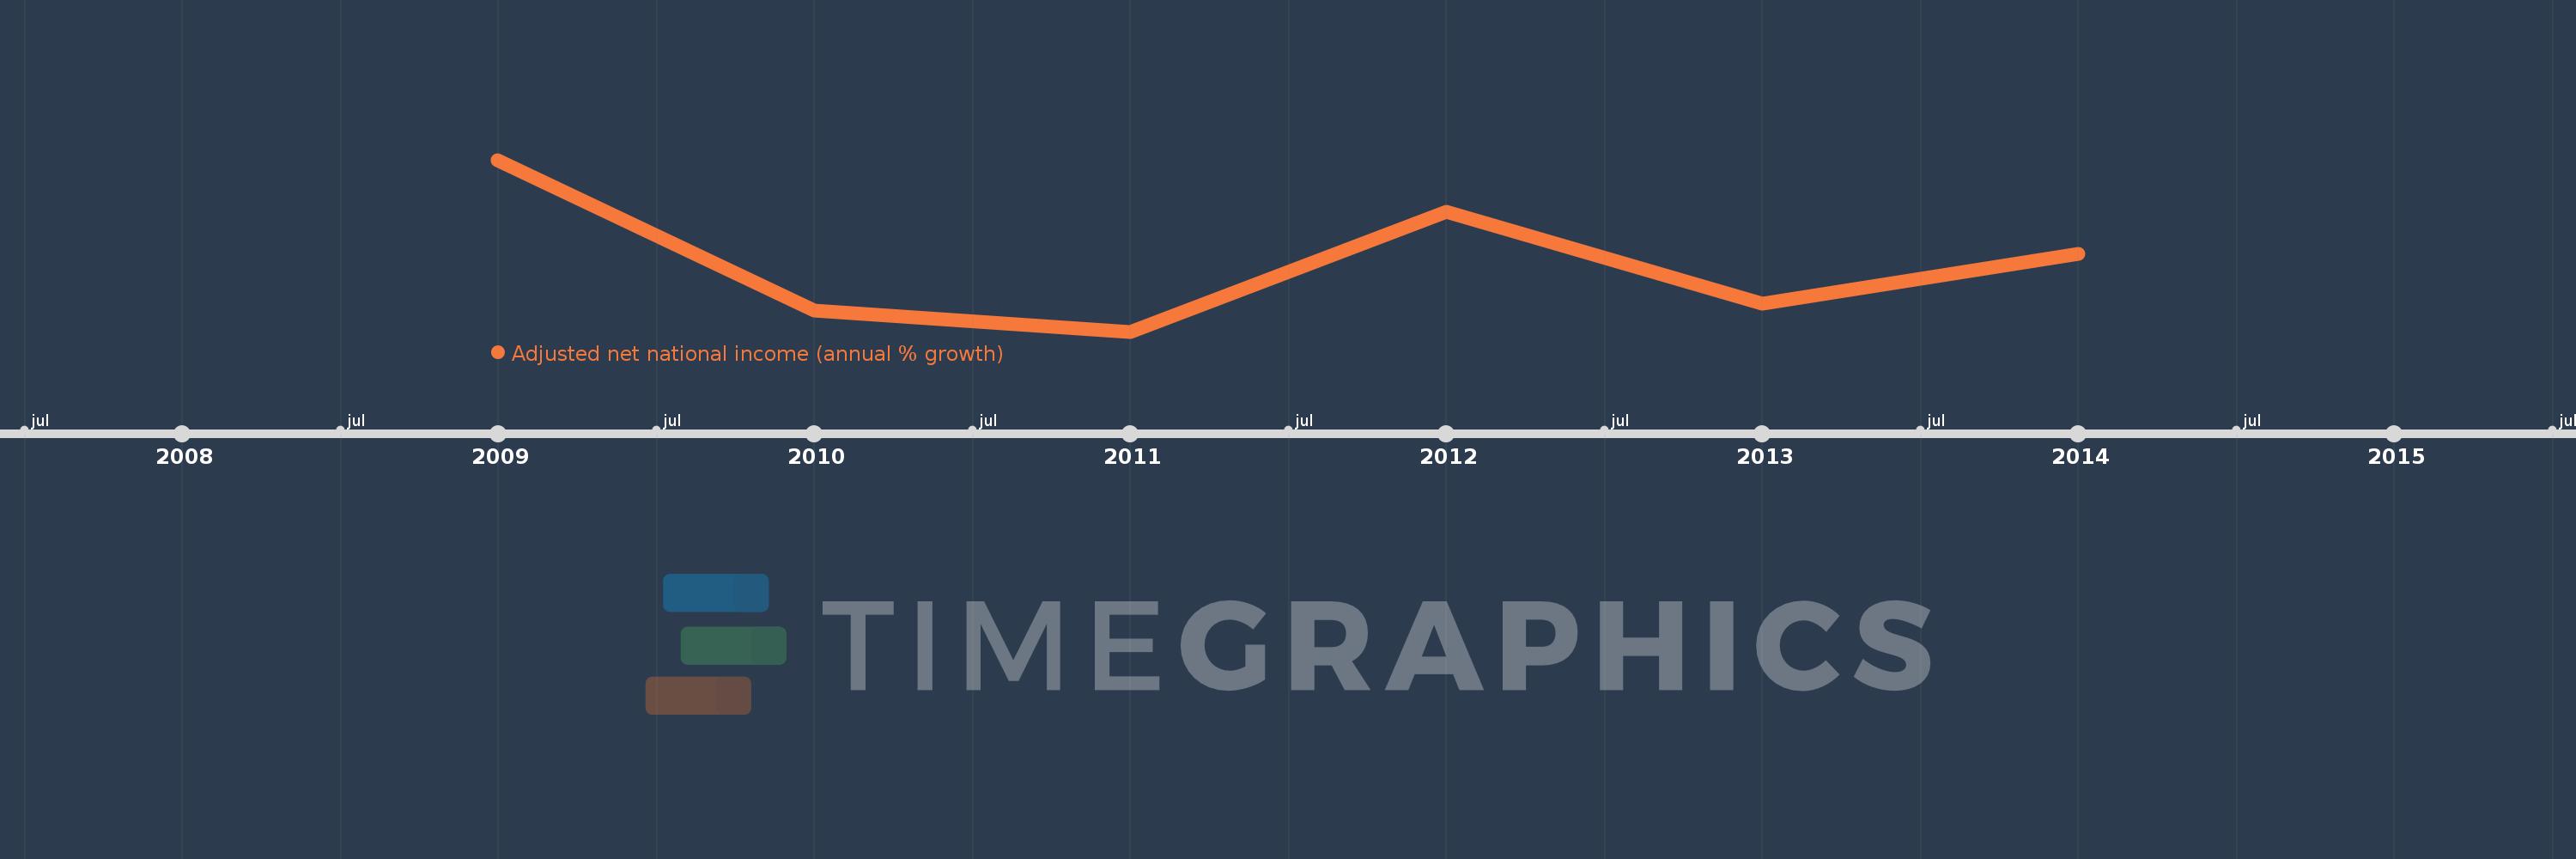
This timeline shows a graph from 2009 to 2014 of Cabo Verde. No data until 2008. Number of actual observations by date: 6.
Source name:
World Development Indicators
Source organization:
World Bank staff estimates based on sources and methods in World Bank's "The Changing Wealth of Nations: Measuring Sustainable Development in the New Millennium" (2011).
Categories, topics:
Economy & Growth
Last updated:
apr 23, 2017
Indicators value changes by year
Meaning:
0.705
Minimum:
-1.76
jan 1, 2011
Maximum:
4.318
jan 1, 2009
At the date of observation
Value
Absolute change
Change from the previous value
jan 1, 2009
4.318
+4.318
0.0%
jan 1, 2010
-1.012
-5.329
-123.43%
jan 1, 2011
-1.76
-0.748
73.99%
jan 1, 2012
2.473
+4.233
-240.49%
jan 1, 2013
-0.775
-3.248
-131.34%
jan 1, 2014
0.986
+1.761
-227.22%
Ranking of countries by current statistics by years