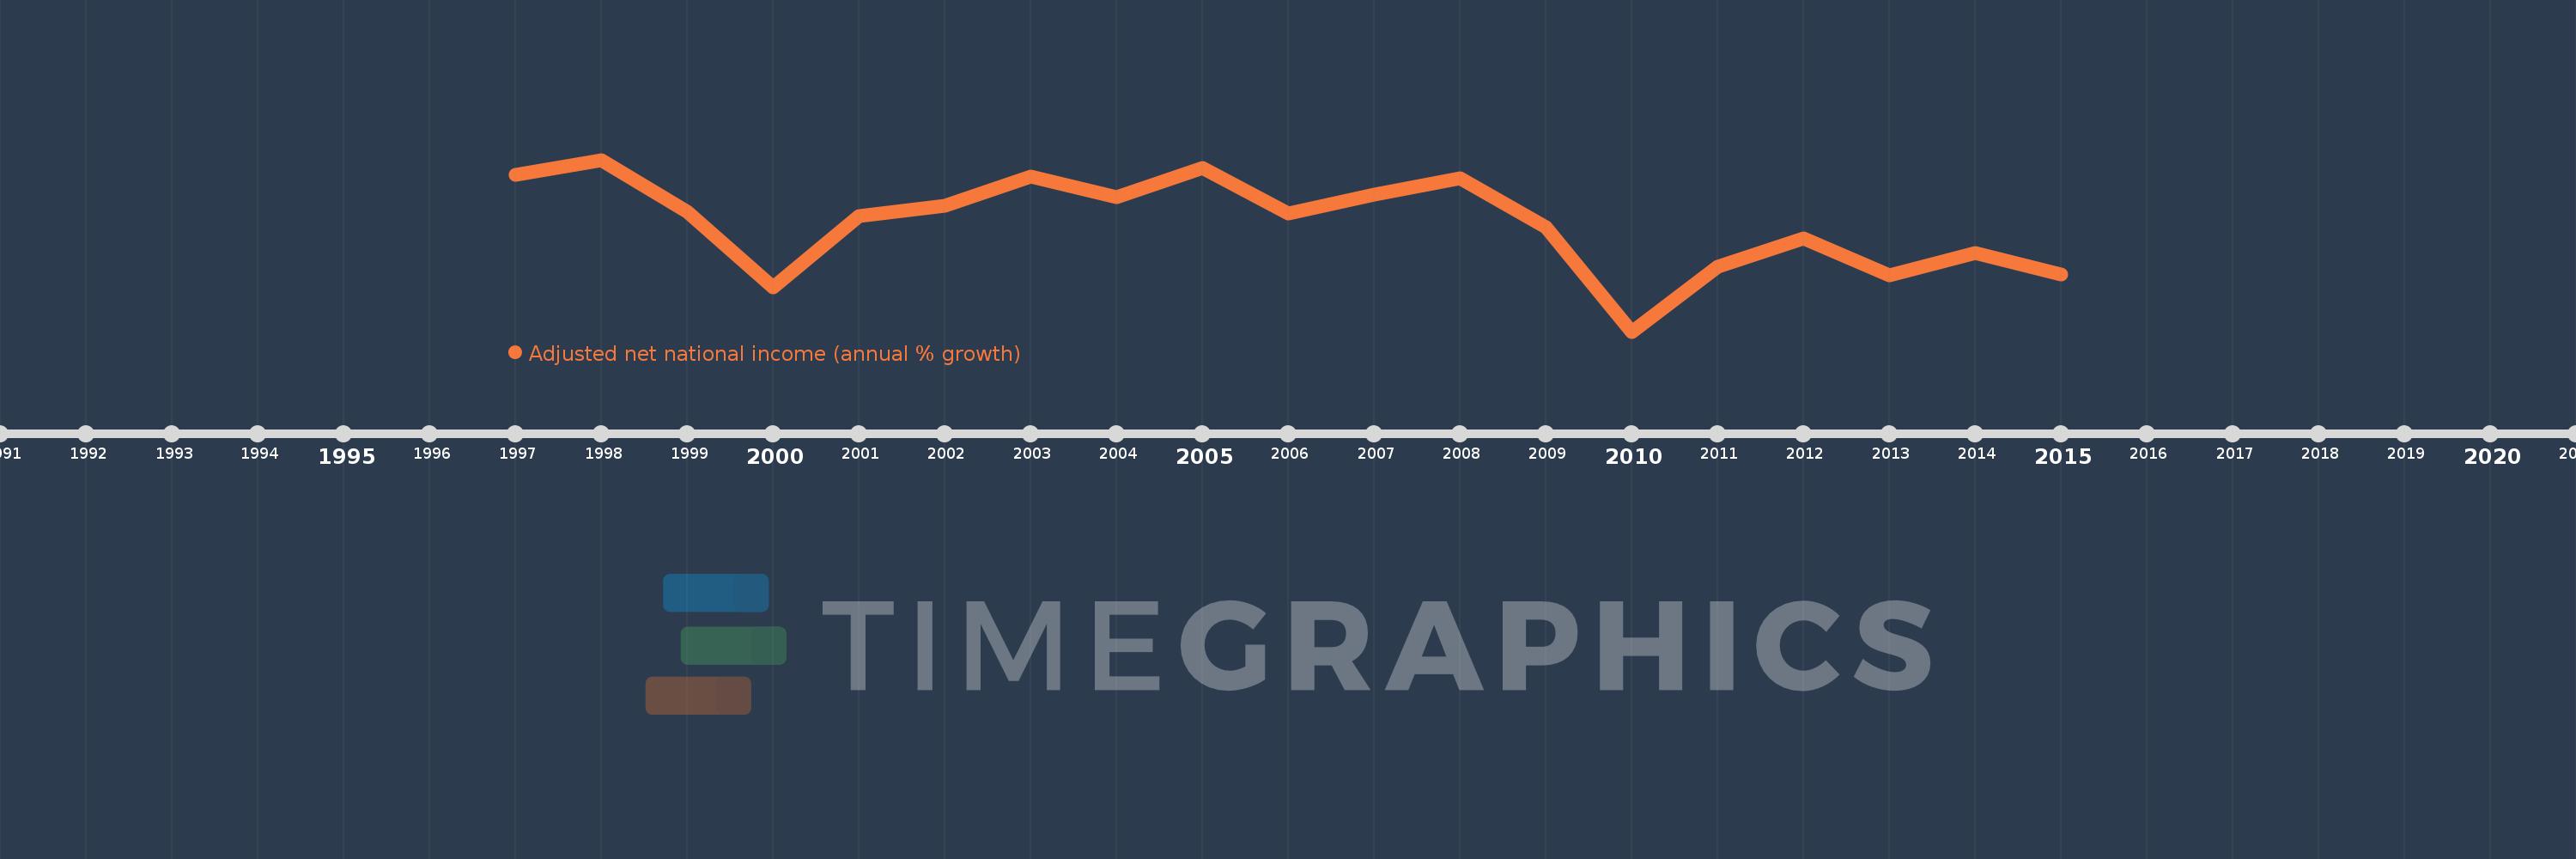
This timeline shows a graph from 1997 to 2015 of Croatia. No data until 1996. Number of actual observations by date: 19.
Source name:
World Development Indicators
Source organization:
World Bank staff estimates based on sources and methods in World Bank's "The Changing Wealth of Nations: Measuring Sustainable Development in the New Millennium" (2011).
Categories, topics:
Economy & Growth
Last updated:
apr 23, 2017
Indicators value changes by year
Meaning:
2.015
Minimum:
-8.153
jan 1, 2010
Maximum:
8.037
jan 1, 1998
At the date of observation
Value
Absolute change
Change from the previous value
jan 1, 1997
6.597
+6.597
0.0%
jan 1, 1998
8.037
+1.44
21.82%
jan 1, 1999
3.18
-4.856
-60.43%
jan 1, 2000
-4.024
-7.204
-226.52%
jan 1, 2001
2.765
+6.789
-168.72%
jan 1, 2002
3.734
+0.969
35.04%
jan 1, 2003
6.457
+2.723
72.92%
jan 1, 2004
4.543
-1.914
-29.64%
jan 1, 2005
7.286
+2.742
60.36%
jan 1, 2006
3.016
-4.269
-58.6%
jan 1, 2007
4.726
+1.71
56.69%
jan 1, 2008
6.282
+1.556
32.93%
jan 1, 2009
1.679
-4.604
-73.28%
jan 1, 2010
-8.153
-9.831
-585.69%
jan 1, 2011
-2.039
+6.114
-74.99%
jan 1, 2012
0.616
+2.655
-130.22%
jan 1, 2013
-2.852
-3.469
-562.91%
jan 1, 2014
-0.776
+2.077
-72.8%
jan 1, 2015
-2.786
-2.01
259.08%
Ranking of countries by current statistics by years