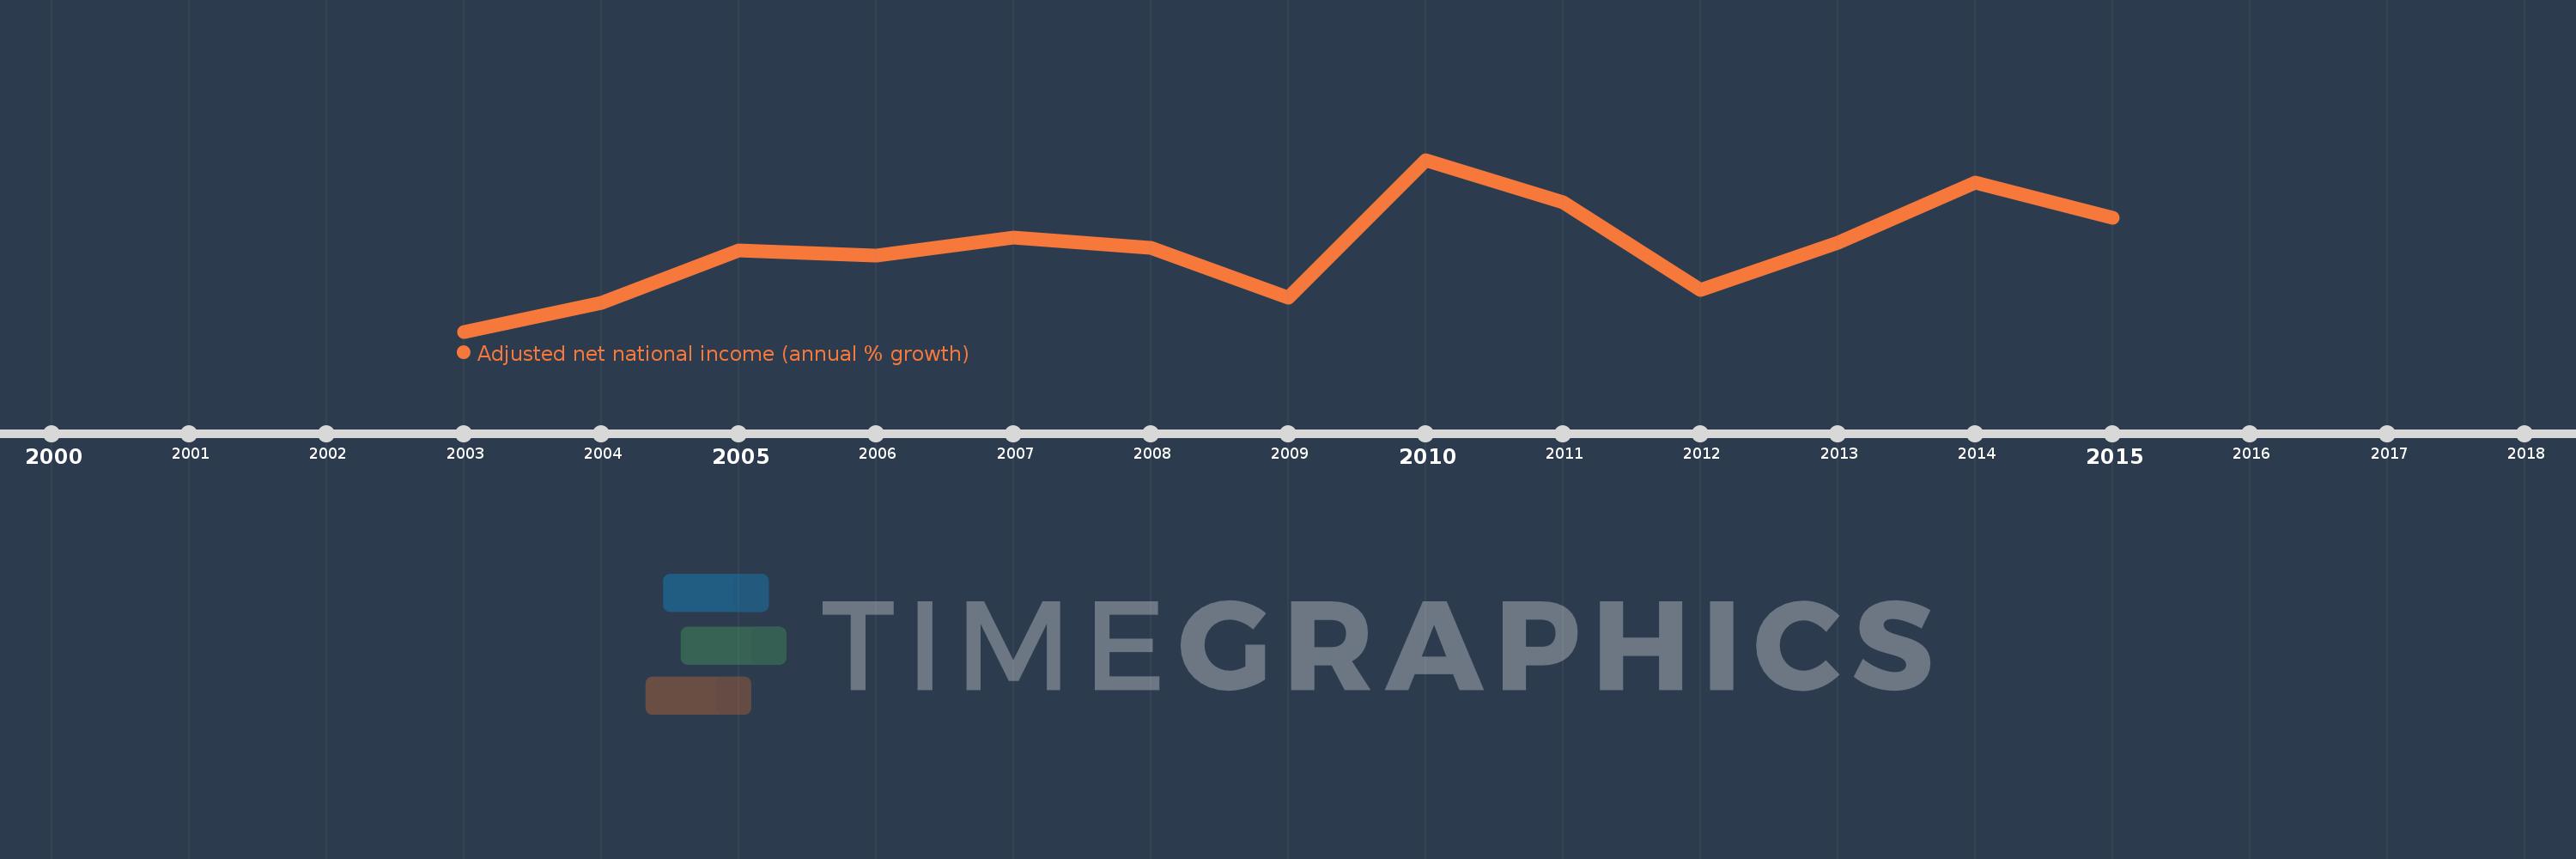
This timeline shows a graph from 2003 to 2015 of Low income. No data until 2002. Number of actual observations by date: 13.
Source name:
World Development Indicators
Source organization:
World Bank staff estimates based on sources and methods in World Bank's "The Changing Wealth of Nations: Measuring Sustainable Development in the New Millennium" (2011).
Categories, topics:
Economy & Growth
Last updated:
apr 23, 2017
Indicators value changes by year
Meaning:
4.259
Minimum:
0.672
jan 1, 2003
Maximum:
8.007
jan 1, 2010
At the date of observation
Value
Absolute change
Change from the previous value
jan 1, 2003
0.672
+0.672
0.0%
jan 1, 2004
1.891
+1.219
181.29%
jan 1, 2005
4.142
+2.251
119.06%
jan 1, 2006
3.901
-0.241
-5.82%
jan 1, 2007
4.691
+0.79
20.25%
jan 1, 2008
4.253
-0.438
-9.33%
jan 1, 2009
2.118
-2.136
-50.21%
jan 1, 2010
8.007
+5.889
278.11%
jan 1, 2011
6.186
-1.821
-22.75%
jan 1, 2012
2.445
-3.741
-60.48%
jan 1, 2013
4.463
+2.019
82.57%
jan 1, 2014
7.05
+2.587
57.96%
jan 1, 2015
5.541
-1.509
-21.4%
Ranking of countries by current statistics by years