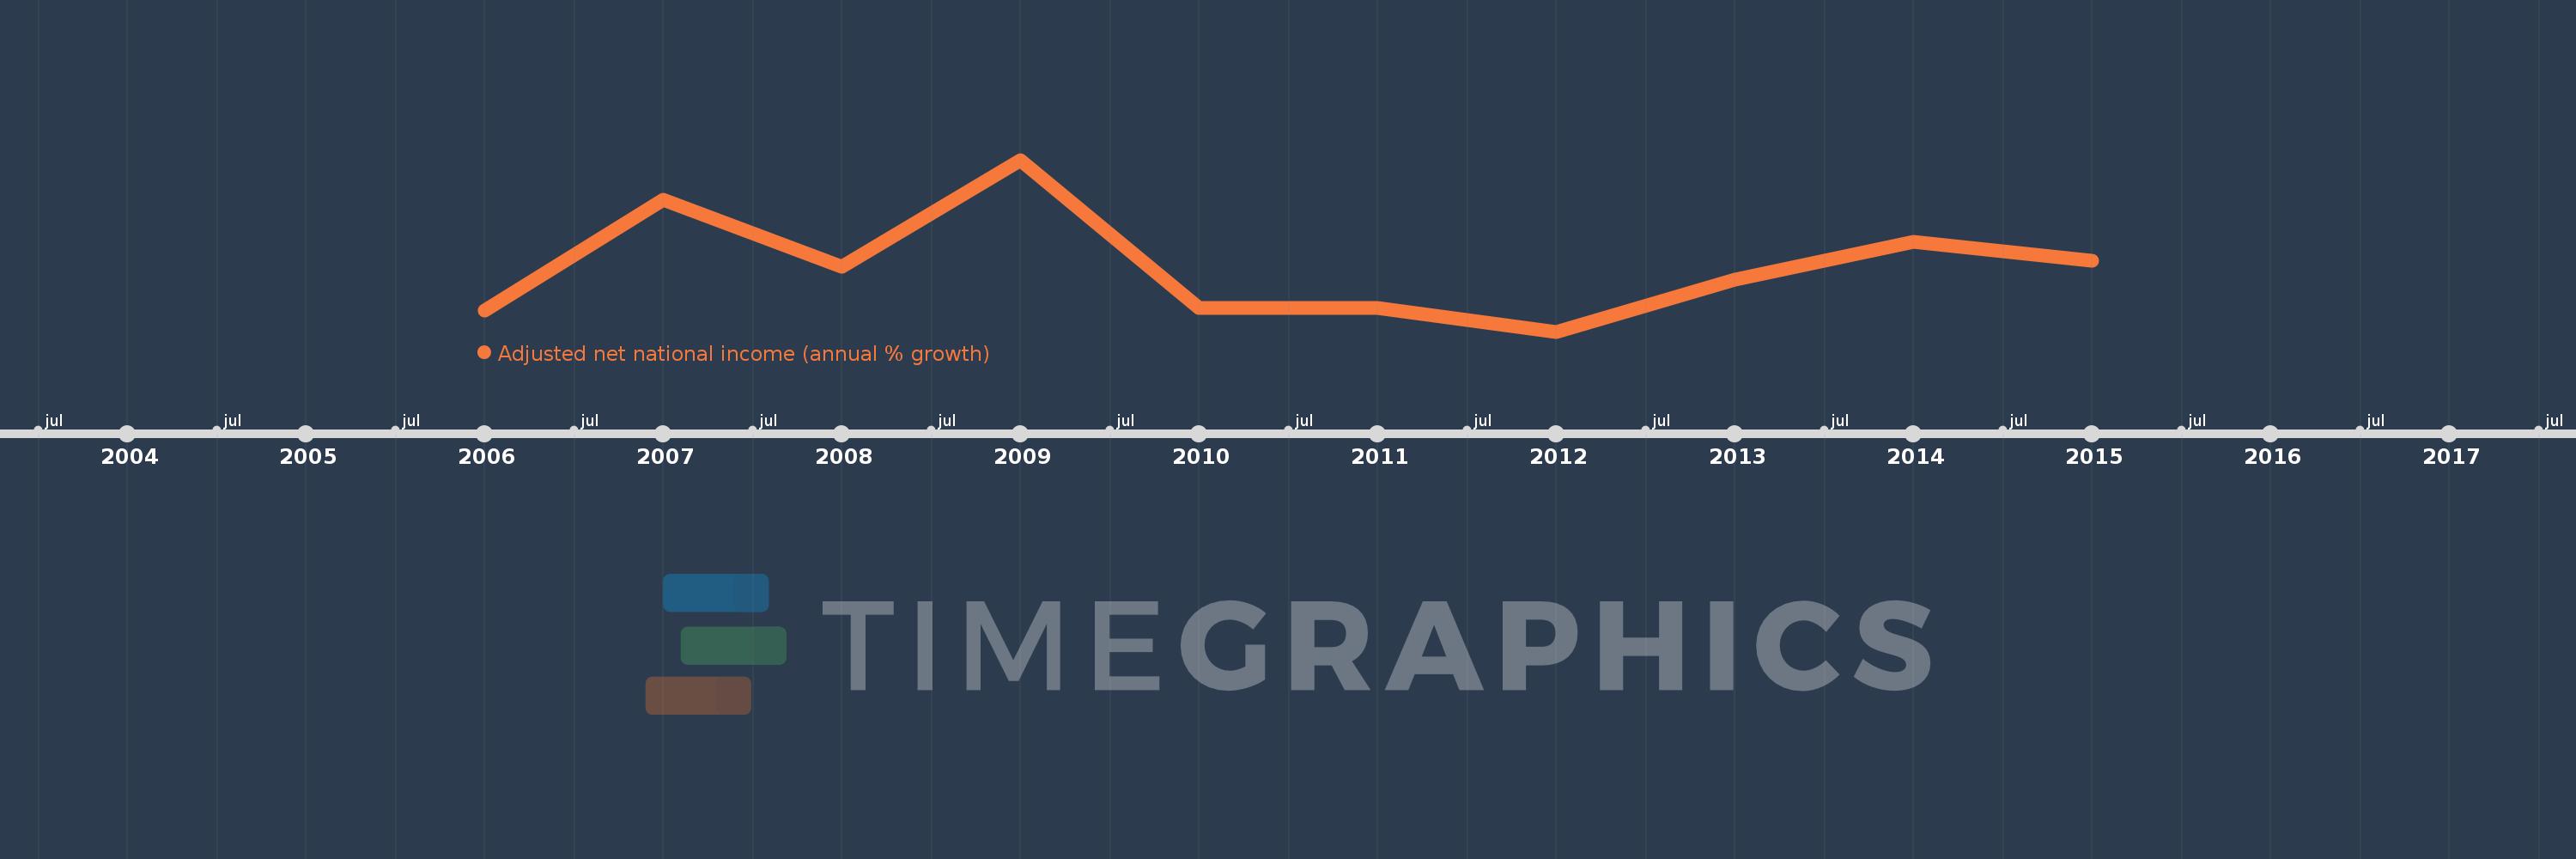
This timeline shows a graph from 2006 to 2015 of Vanuatu. No data until 2005. Number of actual observations by date: 10.
Source name:
World Development Indicators
Source organization:
World Bank staff estimates based on sources and methods in World Bank's "The Changing Wealth of Nations: Measuring Sustainable Development in the New Millennium" (2011).
Categories, topics:
Economy & Growth
Last updated:
apr 23, 2017
Indicators value changes by year
Meaning:
5.057
Minimum:
-2.856
jan 1, 2012
Maximum:
18.101
jan 1, 2009
At the date of observation
Value
Absolute change
Change from the previous value
jan 1, 2006
-0.299
-0.299
0.0%
jan 1, 2007
13.217
+13.516
-4.52K%
jan 1, 2008
5.025
-8.193
-61.98%
jan 1, 2009
18.101
+13.076
260.24%
jan 1, 2010
-0.014
-18.114
-100.08%
jan 1, 2011
-0.019
-0.005
39.34%
jan 1, 2012
-2.856
-2.837
14.76K%
jan 1, 2013
3.486
+6.342
-222.06%
jan 1, 2014
8.097
+4.611
132.28%
jan 1, 2015
5.832
-2.265
-27.98%
Ranking of countries by current statistics by years